S&P 500 Index, VOO ETF could surge 20%, JPMorgan predicts


The S&P 500 Index and its top ETFs, like the VOO and SPY, have already jumped by 16% this year, and analysts at JPMorgan expect they may soon surge by 20% by 2027 as tailwinds rise.
- Analysts at JPMorgan believes that the S&P 500 Index has more upside in 2026.
- The analysts see the index jumping to $7,600 in 2026 and $8,200 in 2027.
- Other Wall Street analysts are highly bullish on the index and its ETFs like SPY and VOO.
The S&P 500 Index was trading at $6,830 on Wednesday, after rising by 41% from the lowest level this year
JPMorgan, the largest bank in the U.S., expects that the index will jump to $7,400 in 2026 and $8,200 in 2027. This view mirrors that of other Wall Street banks, with Deutsche Bank predicting that it will hit $8,000 in this period. Morgan Stanley’s Mike Wilson, who has been bearish on the stock market, now believes that the index will rise to $7,800.
Wall Street cites at least four main catalysts:
- AI: A 2026 boon will benefit some of the biggest companies in the S&P 500 Index like Nvidia, Alphabet, and Amazon. Some of these analysts disagree with Michael Barry, who has warned of an AI bubble that could pop soon.
- Strong corporate earnings. A report released last week by FactSet showed that the earnings growth in the third-quarter was 13.4%, the fourth consecutive quarter of double-digit growth. This earnings growth may continue as the impact of tariffs wanes.
- Interest rate cuts in 2026. Odds of the Federal Reserve cutting rate cuts in December have jumped to 85% on Polymarket, and Trump is considering Kevin Hassett as the next chair. Hassett has been a big advocate for cutting interest rates.
- Dry powder: Cash piles will likely rotate to the stock market in 2026, JPMorgan analysts say. “A lot of our clients are sitting on a lot of cash right now, and for those clients, the conversations that we’re having with an eye out 12 to 18 months is that this is an opportunity.”
S&P 500 Index nears key barrier
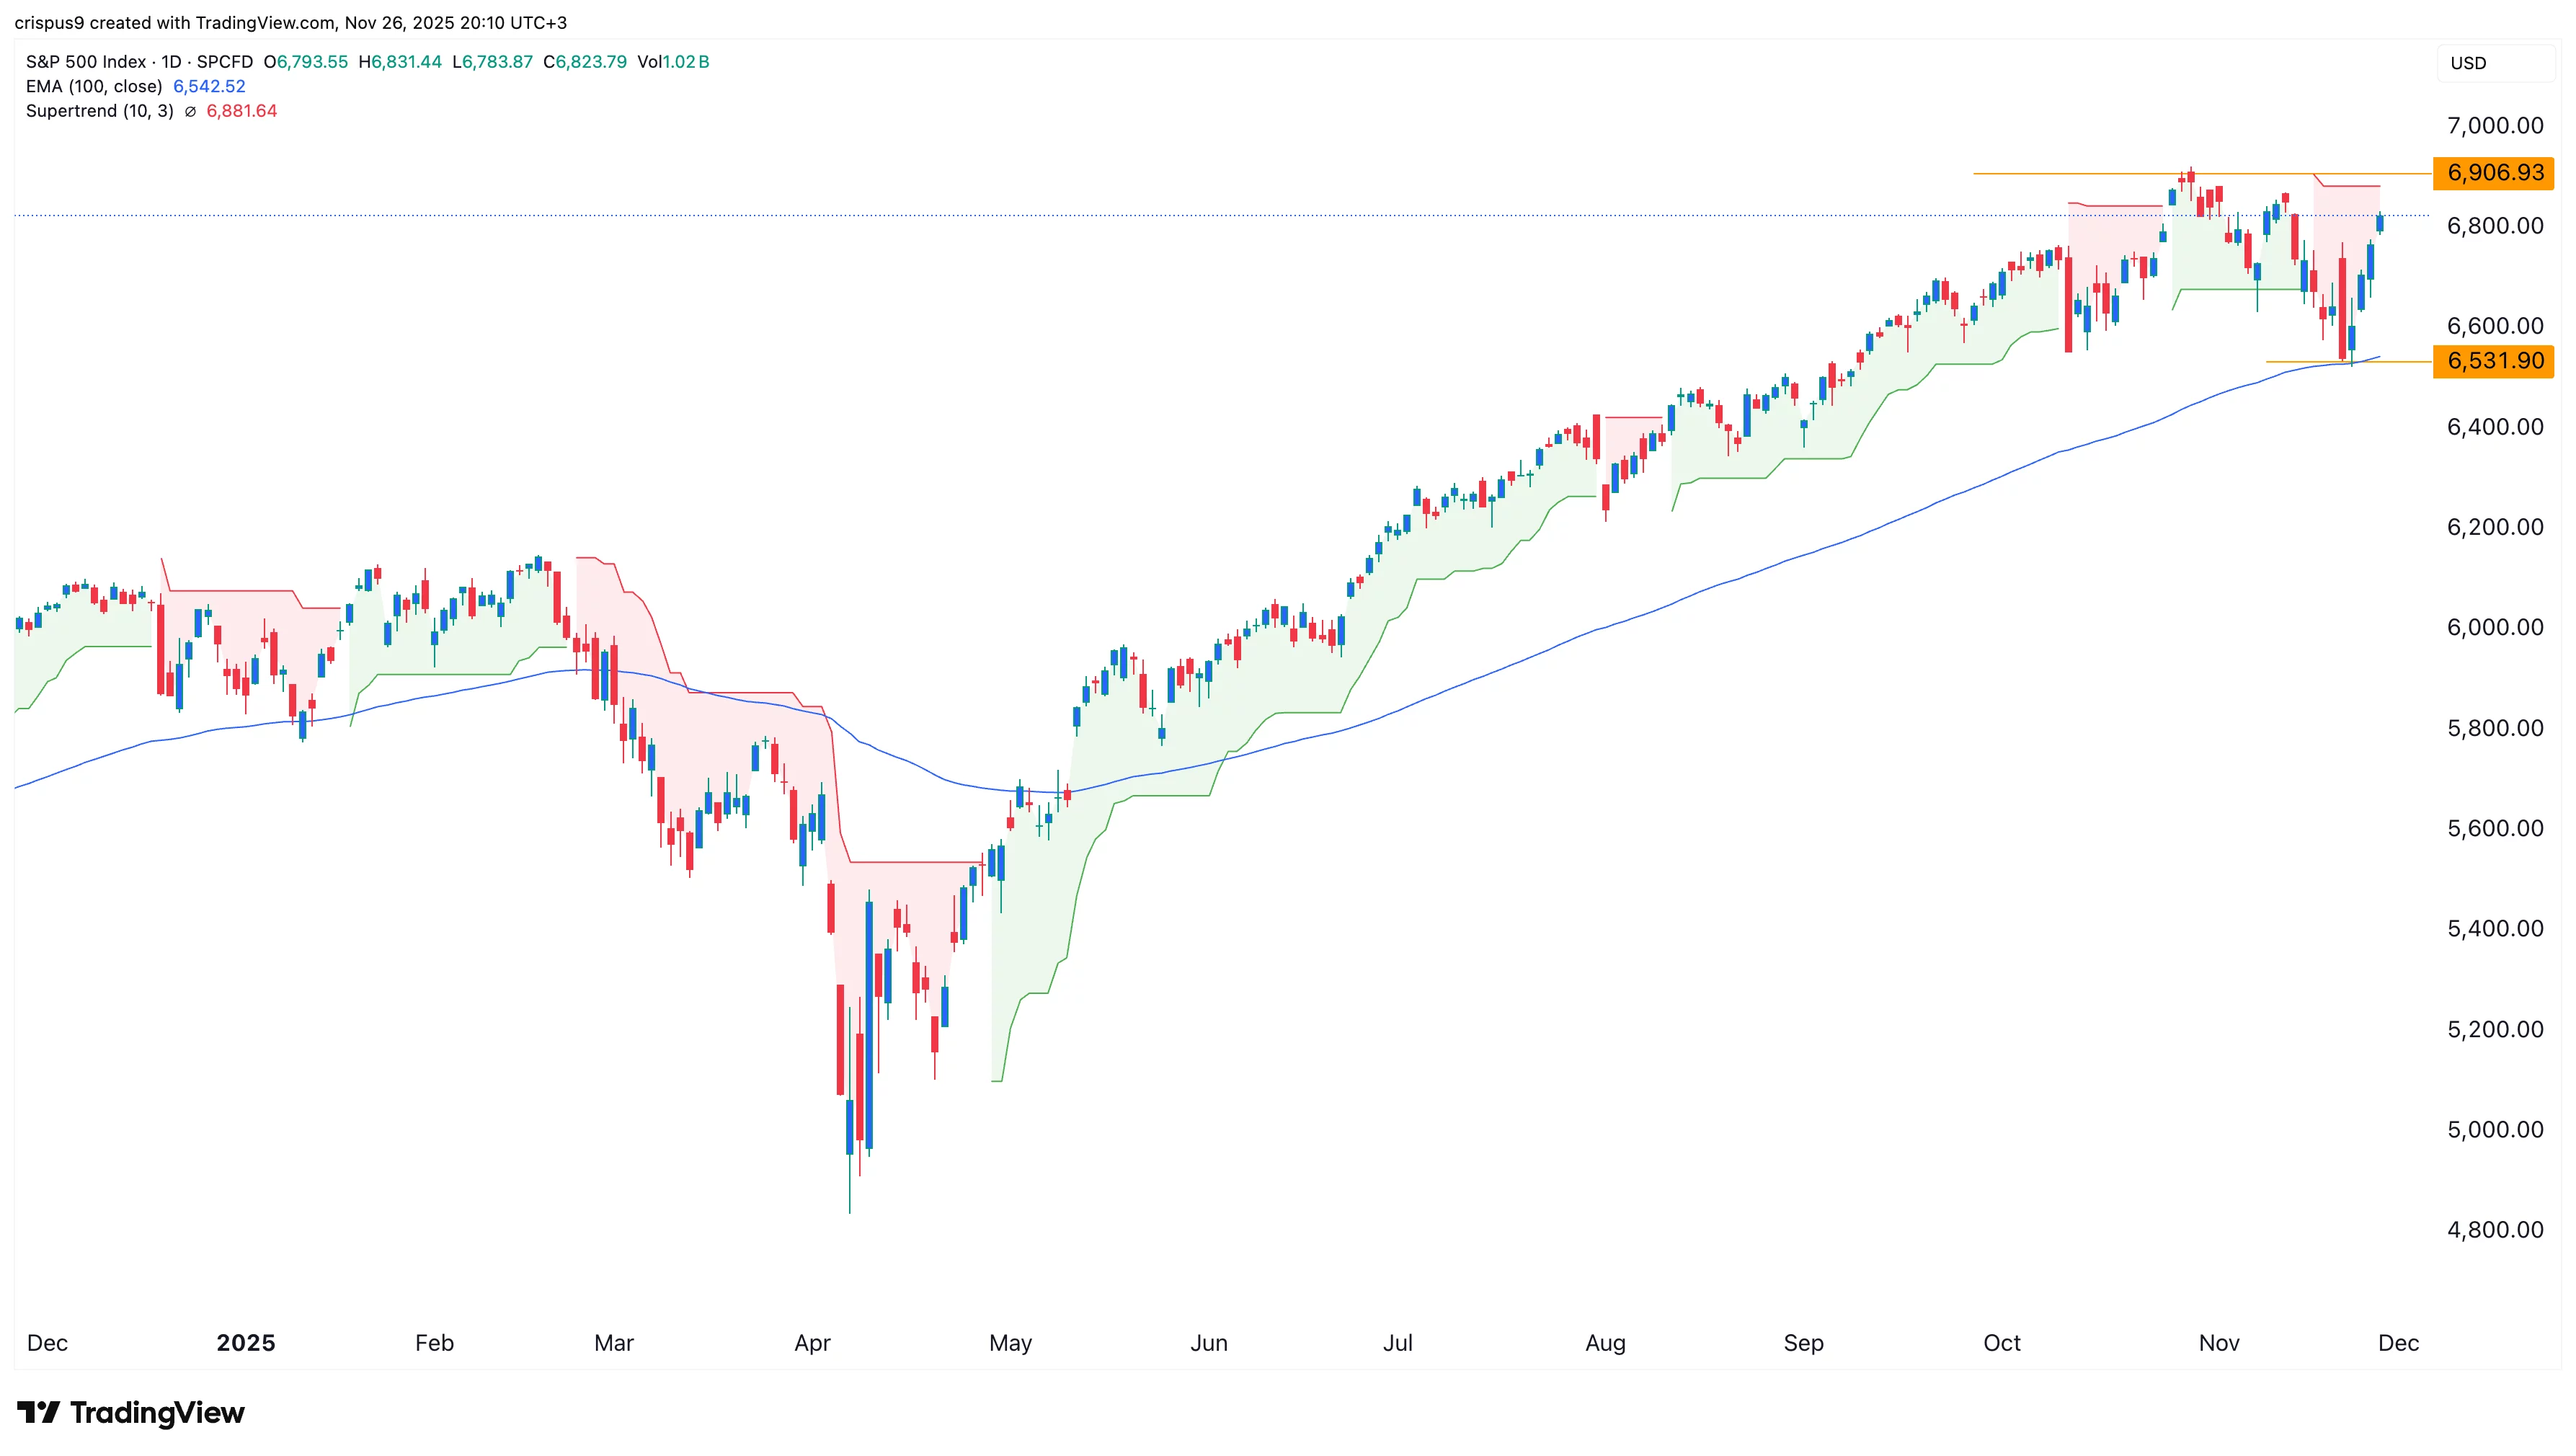
Technicals are supportive of the S&P 500 Index. The daily timeframe chart shows that the coin has remained above the 50-day moving average, a sign that bulls are in control for now. It has also moved above the Supertrend indicator.
However, the index will need to flip the critical resistance level at $6,906 into support. Moving above this level will signal more upside, as it will invalidate the forming double-top pattern.