SUI eyes breakout as Nasdaq files to list 21Shares SUI ETF


Sui is recovering from consolidation as developments around exchange-traded funds fuel fresh momentum.
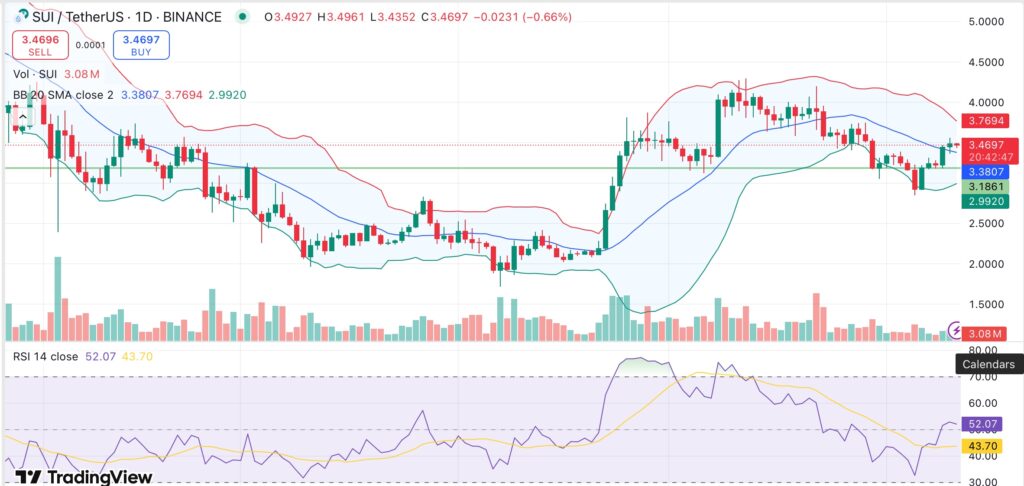
At press time, Sui (SUI) is trading at $3.46, up 2.1% in the past 24 hours and rebounding from a weekly low of $2.92 on June 6. The dip had been driven by market fallout from the Cetus (CETUS) hack and broader macroeconomic pressures. SUI’s recovery, however, might be aided by fresh institutional momentum.
With a 24-hour trading volume of $1.01 billion, up 300% from the day before, SUI’s market activity has significantly increased. As per Coinglass data, SUI’s derivatives volume rose 6.44% to $5.16 billion, while open interest climbed 3.53% to $1.52 billion, a sign that more traders are taking leveraged positions and expecting near-term volatility or movement.
The surge coincides with a major development. According to a June 10 announcement by the Sui Foundation, Nasdaq has filed a 19b-4 with the SEC to list the 21Shares SUI ETF, officially kicking off the regulatory review process for a U.S. spot ETF based on the SUI token.
The filing follows 21Shares’ April S-1 registration and builds on the firm’s SUI exchange-traded product listings already live on Euronext Paris and Amsterdam.
“The milestone of a Nasdaq filing is a powerful moment,” said Kevin Boon, President of Mysten Labs. “We’re proud to help 21Shares build toward a world where every investor can access SUI.”
Over $300 million is already invested in SUI-based ETPs globally. Institutional firms such as Franklin Templeton, VanEck, and Grayscale have launched products on Sui since late 2024, reflecting its appeal as a high-performance Layer 1 chain.
Looking at the technical picture, SUI appears to be eyeing a breakout from consolidation. Bollinger Bands are beginning to tighten, and price action is hovering near the middle band at $3.38. At 52.5, the relative strength index confirms a neutral bias but still has room to rise before reaching overbought territory.
The MACD’s entry into positive territory could be a potential early indicator of bullish momentum. Although it’s still negative, the awesome oscillator is flattening, indicating a possible change in momentum. The estimated moving averages from 10 to 200 days are flashing buy, but the 30- and 50-day simple moving averages exhibit a slight bearish lag.
If the price manages to close above $3.50 with confirmation through rising volume, SUI could test the previous local high near $3.80, and possibly push toward $4.20 if ETF optimism holds. Failure to break above resistance, however, could see SUI drift back to $3.20–$3.00 support, especially if broader risk sentiment weakens.