SUI gears up for recovery as technical signals hint at breakout move


SUI may be setting up for a rebound, with momentum returning across both technical and on-chain fronts.
As of Monday afternoon Asian time, Sui (SUI) was trading at $3.20, down about 25% from its peak last month. Its market cap sat at around $10.8 billion, according to data from crypto.news.
One of the setbacks weighing on SUI recently was the SEC’s decision to delay its ruling on the proposed Canary SUI ETF, a move that would’ve given investors regulated exposure to the token. While ETF delays are pretty standard in the approval process, they often dent market sentiment, especially in already shaky conditions.
SUI has also been under pressure following a major exploit on May 22, when the Cetus Protocol, one of the core DeFi platforms built on the Sui network, was hacked. The incident impacted around $223 million in assets, triggering widespread concerns across the ecosystem.
Still, there are signs the worst could be over. Data from DeFiLlama shows that total value locked across Sui-based DEXs jumped 4.8% over the past week. In fact, Sui’s total TVL now stands at $3.05 billion, over 50% higher than early April’s $2 billion figure.
Part of this growth is being driven by the surge in Bitcoin-pegged assets on the network. Around 10% of Sui’s TVL is now held in tokens like wBTC, LBTC, and stBTC. On top of that, over $1.1 billion in stablecoins is now circulating in the Sui ecosystem, helping improve liquidity for both developers and traders.
Supporting the bullish outlook, SUI’s weighted funding rate has remained positive for nine consecutive days, indicating that traders continue to bet on the upside.
Sui price analysis
On the technical side, things are starting to look promising. SUI appears to be breaking out of a multi-week falling wedge pattern on the daily chart, often a sign that a reversal might be coming.
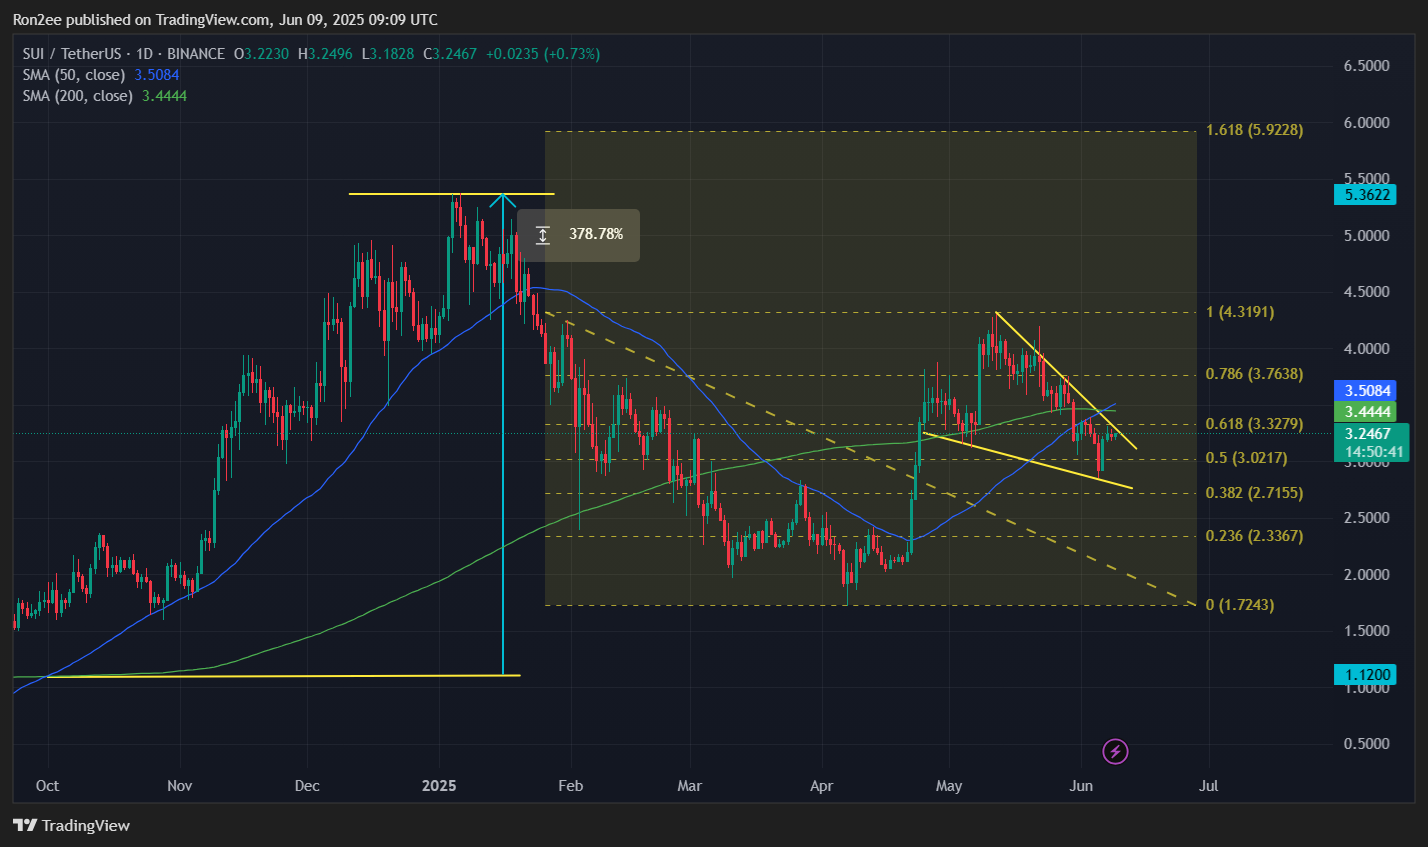
SUI has also printed a golden cross, with the 50-day simple moving average crossing above the 200-day SMA. This is one of the most widely watched bullish signals in technical analysis and often marks the start of a new uptrend.
The last time SUI formed a golden cross was in late 2024, when it was trading around $1.10. That crossover was followed by a massive 380% rally, which took SUI all the way to its all-time high of $5.35.
If history repeats itself and bullish momentum builds, SUI could be on track to retest that ATH and maybe even break past it. The next major resistance to watch is around $4.31. A clean break above that level could open the door to a move toward the 161.8% Fibonacci extension at $5.92.
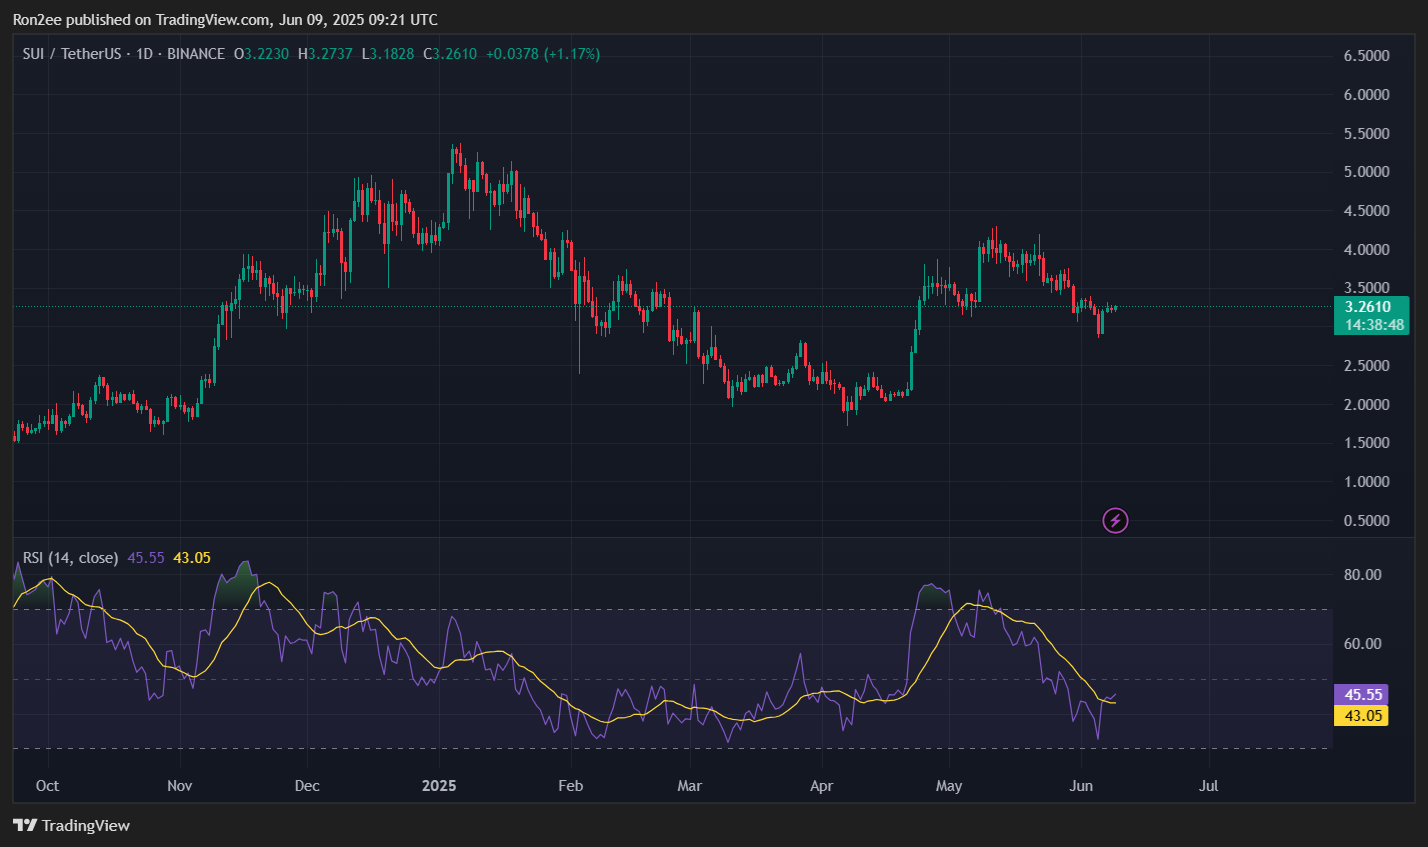
That said, technical indicators still need confirmation. The RSI has started trending upward but hasn’t crossed above 50 yet. A move above this threshold would suggest that stronger buying momentum is taking over.
However, the golden cross alone may not be sufficient to sustain a major rally without strong follow-through from buyers. Continued bearish overhang, such as the SEC’s delay of the spot SUI ETF, could also limit upside momentum in the near term.
If bulls fail to step in with strong buying volume, SUI’s price could retreat, with $2.33 acting as the key support level to watch on the downside.
Disclosure: This article does not represent investment advice. The content and materials featured on this page are for educational purposes only.