SUI hits six-month peak following USDC integration

Sui has recorded an impressive price rally last day following the integration of native USDC on the platform.
At the time of writing, Sui (SUI) was still up 10% over the past day, exchanging hands at $1.2 per price data from crypto.news. The token also registered a 35% price jump over the past seven days — rising from $0.88 on Sep. 11 to a six-month high of $1.22 earlier today.
Following the price hike, SUI’s market cap surpassed the $3.2 billion mark — making it the 30th-largest crypto asset — with a daily trading volume of roughly $673 million.
One of the main reasons behind SUI’s price surge could be its upcoming integration of native USDC and the Cross-Chain Transfer Protocol, which is expected to boost liquidity and cross-chain transactions.
The upgrade will allow users and developers on the Sui network to expand the use of USDC in a range of applications such as decentralized finance, gaming, and e-commerce, potentially increasing market demand for SUI.
Another factor potentially fueling the rally could be the Sui Foundation’s announcement of a partnership with MoviePass, a movie subscription service based in the U.S.
Rising futures demand and expanding DeFi ecosystem
The coin’s rebound aligns with growing demand in the futures market, where open interest has soared to a new peak. Data from CoinGlass shows that open interest reached $315 million, surpassing the previous record of $290 million and marking a substantial rise from less than $52 million in August.
Meanwhile, data from DeFi Llama indicates that Sui’s network is becoming more popular with developers and users. The total value locked in its decentralized finance sector has increased by more than 25% in the last 30 days, reaching over $741 million. The majority of these assets are held in NAVI Protocol, Scallop Lend, Suilend, and Aftermath Finance.
SUI’s momentum faces key resistance test
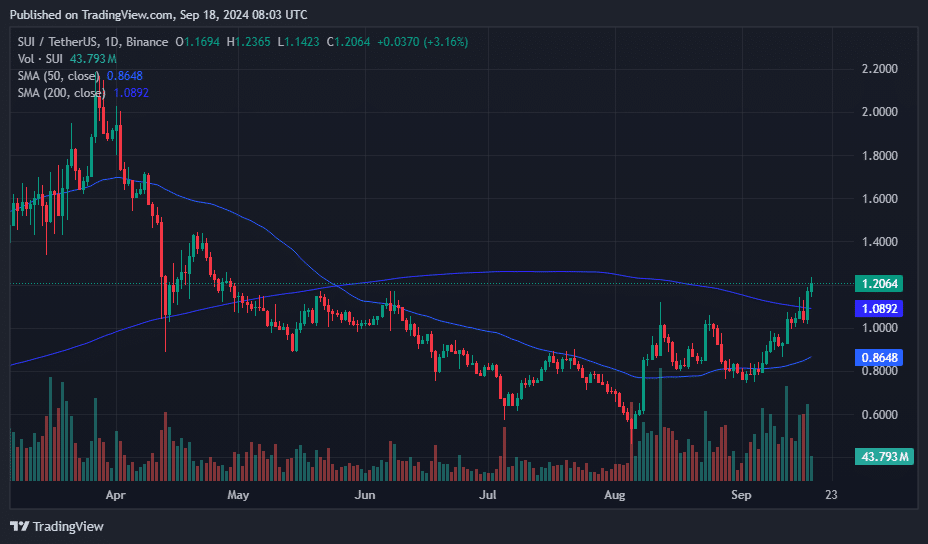
On the daily chart, Sui has risen above both the 50-day and 200-day Simple Moving Averages, and it has developed an inverse head and shoulders pattern, typically considered a bullish indicator.

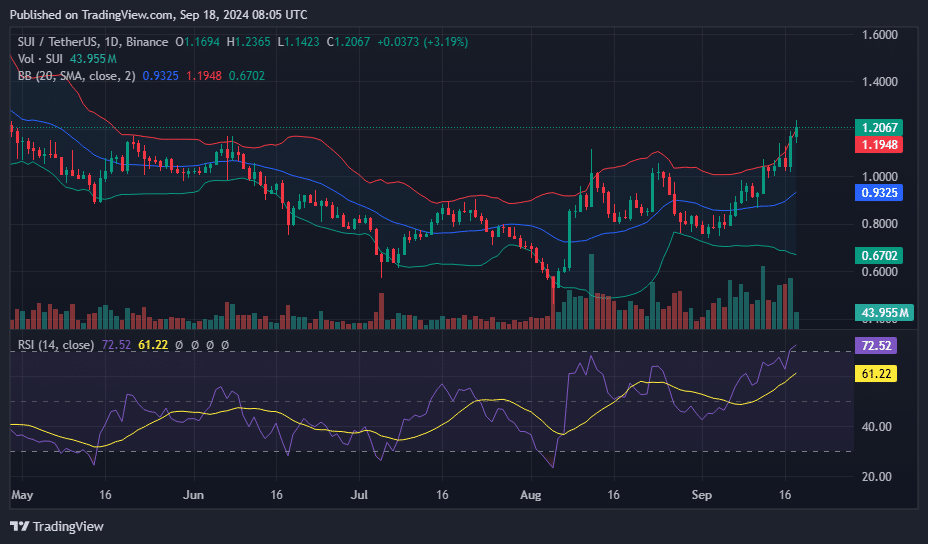
SUI is also positioned above its upper Bollinger Band at $1.1948, indicating strong upward momentum. However, this also suggests the asset is overbought, which could foreshadow a possible pullback or price correction.

Despite the overbought status, prolonged market excitement can sometimes keep an asset in this condition for extended periods. The key resistance level now stands at $1.40, which SUI approached during its rally on April 20. If the momentum persists, a push towards these levels again is plausible.
The Relative Strength Index is slightly elevated at 72.52, just above the overbought threshold of 70, signaling that the asset may soon experience downward pressure as traders potentially begin to take profits.
Should the price decline, the middle Bollinger Band at $0.9325 will serve as immediate support, with a further drop potentially challenging the lower support at $0.6702.


