SUI price stalls below $4 resistance as $223M Cetus Protocol hack weighs down on sentiment


SUI is trading at $3.62 at press time, down 1% in the past 24 hours, as the token struggles to recover from the aftermath of the $223 million Cetus Protocol hack on May 22.
The attack, which is one of the biggest decentralized finance hacks this year, has cast a shadow over Sui’s (SUI) ecosystem. It has sparked concerns about the network’s decentralization and stalled bullish momentum. Before the attack, SUI had risen more than 60% in a month, peaking on at around $4.29 on May 12.
Sui’s impressive rally was thanks to the growing interest in real-world asset tokenization and new institutional partnerships. But the attack triggered a sharp sell-off, with SUI dropping almost 14% in a day. It’s now down nearly 20% from its pre-hack levels and trading in a range between $3.48 and $3.62.
The exploit targeted flaws in Cetus’s smart contracts using spoof tokens like BULLA and MOJO to manipulate price feeds and deplete liquidity pools. The SUI/USDC pool alone had about $11 million stolen from it. Trading was halted, and the total value locked on the Sui chain fell from $2.13 billion to $1.92 billion.
Cetus protocol’s native token fell by 40%, and due to the loss of liquidity, USD Coin (USDC) momentarily lost its dollar peg. Sui validators successfully froze $162 million of the stolen assets by blacklisting the attacker’s wallet. This prevented most of the funds from leaving the network, but it raised questions about the true extent of validators’ power.
Critics argue that freezing transactions on demand goes against the idea of decentralization. Some pointed out that a small number of validators and insiders may control most of the network, with very few users participating in governance.
On the market side, Coinglass data shows that derivatives volume in the last day has jumped nearly 40% to $3.57 billion, suggesting increased short-term interest, likely from volatility traders. At the same time, open interest dropped 2.9% to $1.77 billion, showing signs that some traders may be pulling back or taking profits.
Technical indicators show mixed signals. The relative strength index is neutral at around 50. Short-term momentum indicators point to a possible upside, but the moving average convergence divergence is showing a bearish crossover. Short-term moving averages indicate downward pressure, while longer-term indicators provide more bullish signals.
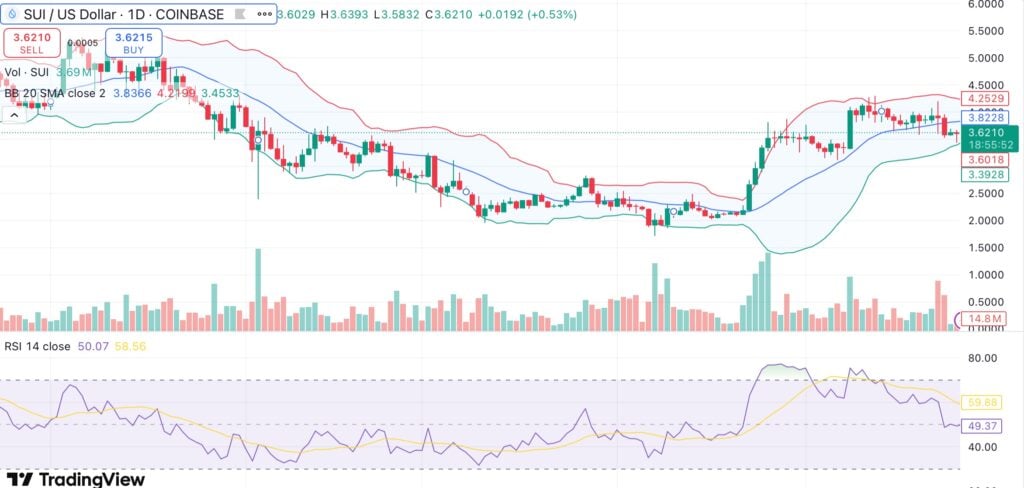
The 50-, 100-, and 200-day moving averages are all flashing buy signals, suggesting that if SUI can withstand the damage caused by the hack, it will continue to be in an overall upward trend. For now, SUI is stuck below the $4 resistance. Traders are watching closely to see whether it can break above or if the fallout from the Cetus hack will keep weighing on the market.