Three reasons why Kaspa price may end its monthly downtrend soon


Kaspa price could be poised to break out of its ongoing downtrend soon, with multiple bullish developments on the horizon.
- Kaspa price is down over 13% this month, and nearly 43% below its yearly high.
- Community speculation over upcoming developments is drawing trader interest towards KAS.
- The token’s price has formed a golden cross on the daily chart.
According to data from crypto.news, Kaspa (KAS) was trading at $0.08, down 13.9% over the past month and 43% lower than its year-to-date high. The token’s market cap, which stood at over $3.9 billion in early January, had also declined to around $2.3 billion as of press time.
Despite this downtrend, a host of fresh developments have emerged that could set it back on a bullish trajectory.
First, the Kaspa team recently teased what looks like plans to enter the traditional payments space along the lines of giants such as Visa, Mastercard, Google Pay, and Apple Pay, among others.
In the Aug 25 X post, it shared an image of a checkout terminal that displayed Kaspa’s logo alongside such top payment giants, accompanied with the caption “.soon”
Not much was revealed about what the upcoming product might be, but it seemed to spark community speculation, leading to renewed interest among traders.
Second, there is also speculation of a Binance listing on the horizon. Community members largely anticipate the launch to go live soon, especially following the launch of the Binance Pool for KAS mining earlier this month.
Binance currently stands as the largest crypto exchange in the world. A spot listing on the exchange would add strong credibility and visibility, which could renew demand for the token among investors.
Third, Kaspa is set to launch its own Layer-2 solution at the end of this month. Dubbed Casplex, the upgrade will introduce smart contract functionality to the network, potentially opening the door to a wide range of applications, including DeFi, NFTs, dApps, and more.
Taken together, all these developments could increase the visibility of the Kaspa token, which could likely bring in fresh retail investment.
Kaspa price analysis
Kaspa saw its strongest performance in January this year, when it surged to a high of $0.15. Since then, the token’s price has followed a consistent pattern of lower highs and lower lows, ultimately bottoming out at its year-to-date low of $0.058 in April.
Following this low, Kaspa’s price action displayed two successive rebounds and pullbacks of decreasing magnitude, culminating in the formation of a symmetrical triangle pattern on the chart. While this is typically regarded as a neutral consolidation structure, it often resolves in the direction of the prevailing trend.
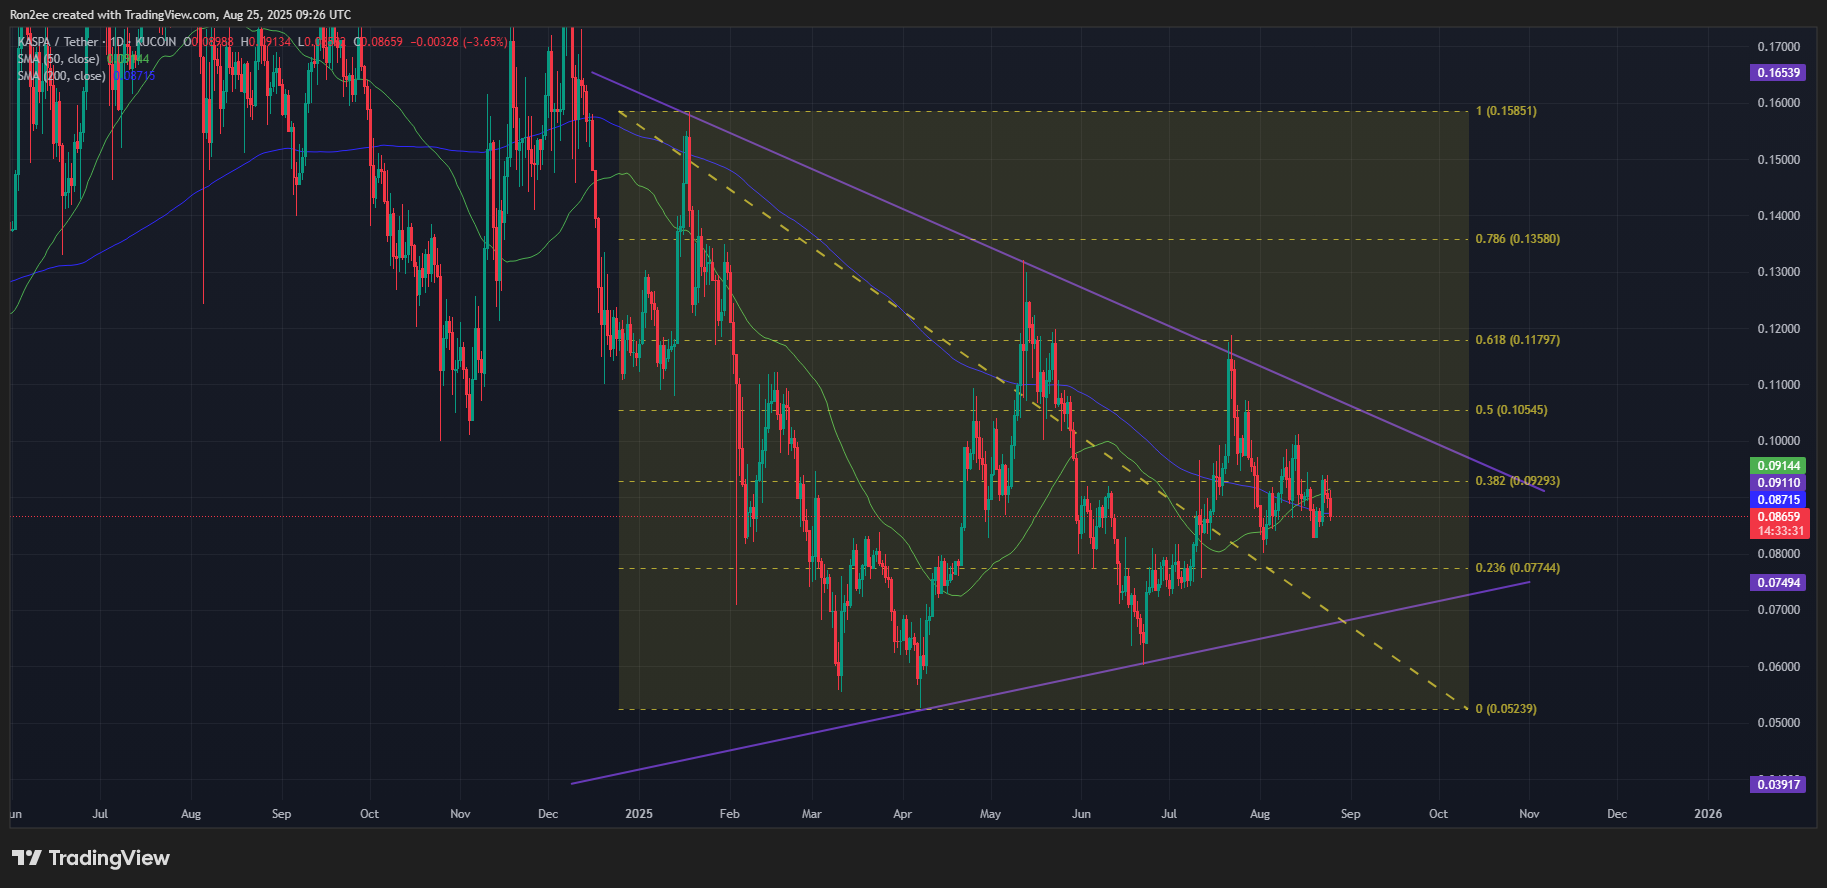
A breakout above the upper trendline would signal a potential bullish reversal, whereas a breakdown below the lower trendline would likely confirm a continuation of the broader bearish trend, exposing the token to further downside risk.
To assess the likely direction of this breakout, additional technical indicators offer valuable insights.
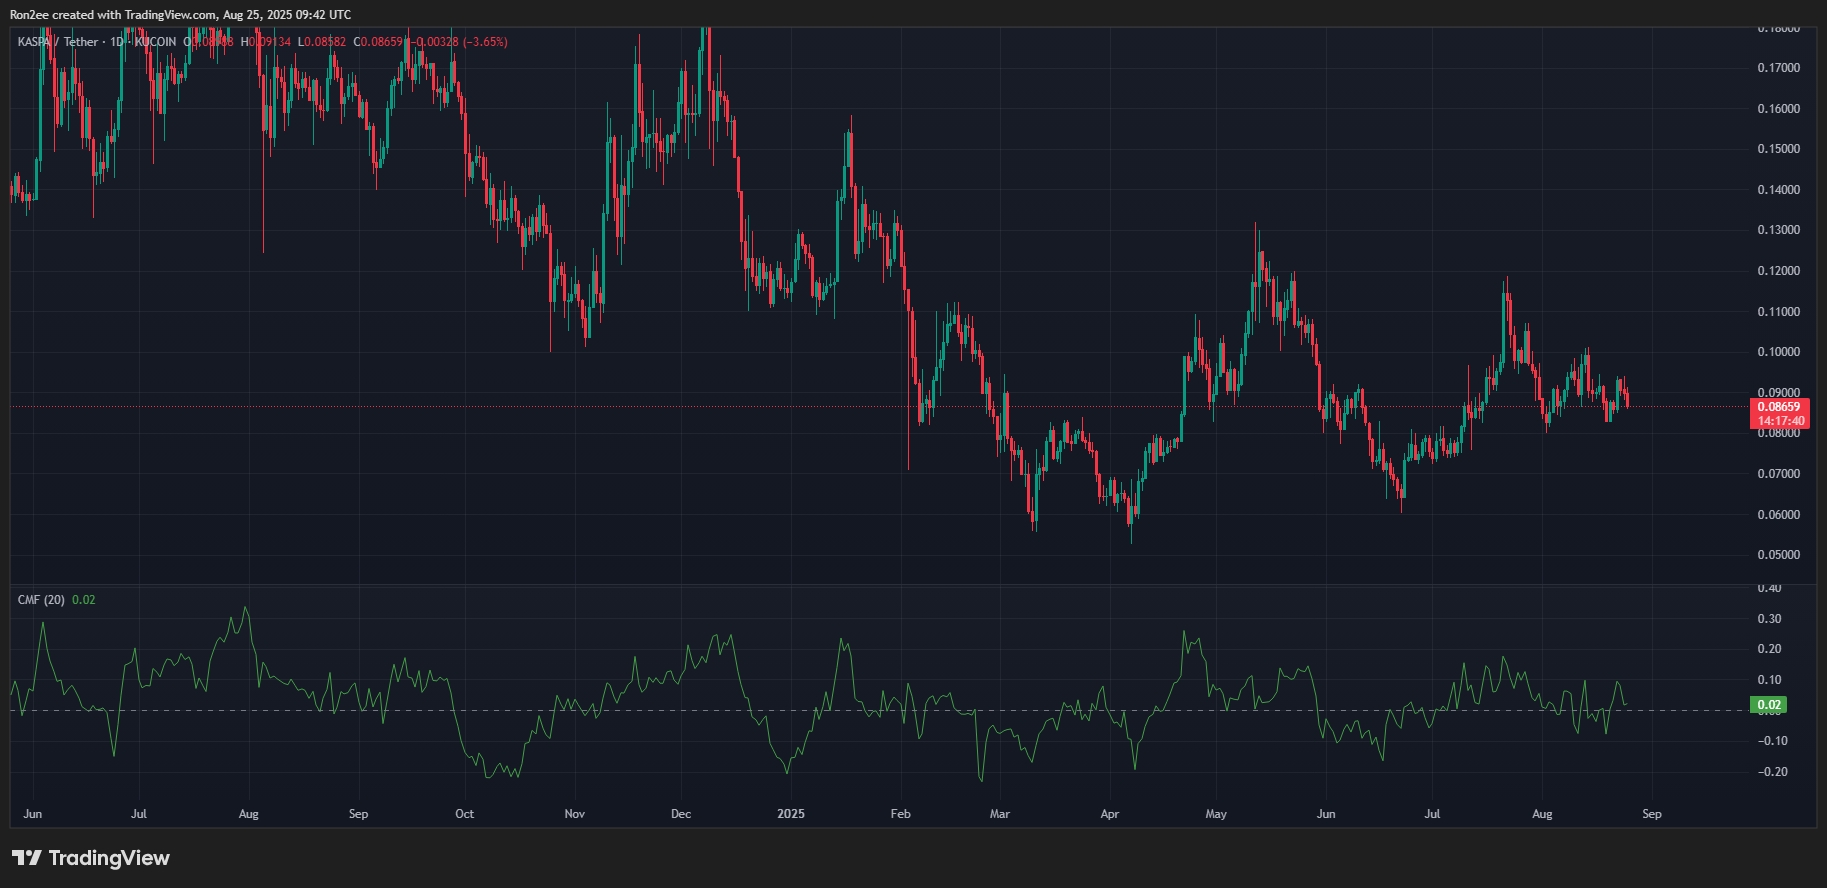
The 50-day simple moving average has recently crossed above the 200-day SMA, forming a golden cross, a widely followed bullish signal that suggests positive momentum may be building. Historically, the last time Kaspa formed a golden cross, the token rallied by 74% over the following two months.
Additionally, the Chaikin Money Flow index is currently showing a positive reading, indicating that buying pressure is outweighing selling pressure, a potential early sign of accumulation by market participants.
Based on these technical signals, a decisive breakout above $0.092, the upper boundary of the triangle, could open the path for a move toward $0.10, a level that aligns closely with the 50% Fibonacci retracement from the January high to the April low. A confirmed breakout from the pattern could pave the way for further upside beyond that threshold.
Conversely, if KAS fails to hold the $0.082 support level, it could trigger renewed selling pressure and lead to a deeper correction, possibly retesting previous lows in the $0.070–$0.060 range.
Disclosure: This article does not represent investment advice. The content and materials featured on this page are for educational purposes only.