Toncoin price steadies with Durov’s release, but analysis points to possible downturns

Toncoin experienced a sharp 27% drop to $5.04 in the wake of Pavel Durov’s arrest. Although the price has since stabilized slightly above that level, the situation remains precarious due to the ongoing investigation surrounding the Russian Zuckerberg. Despite the temporary stabilization, the indicators present a bleak outlook for Toncoin, suggesting potential downturns regardless of the investigation’s outcome. The analysis below outlines the factors contributing to this grim forecast.
Table of Contents
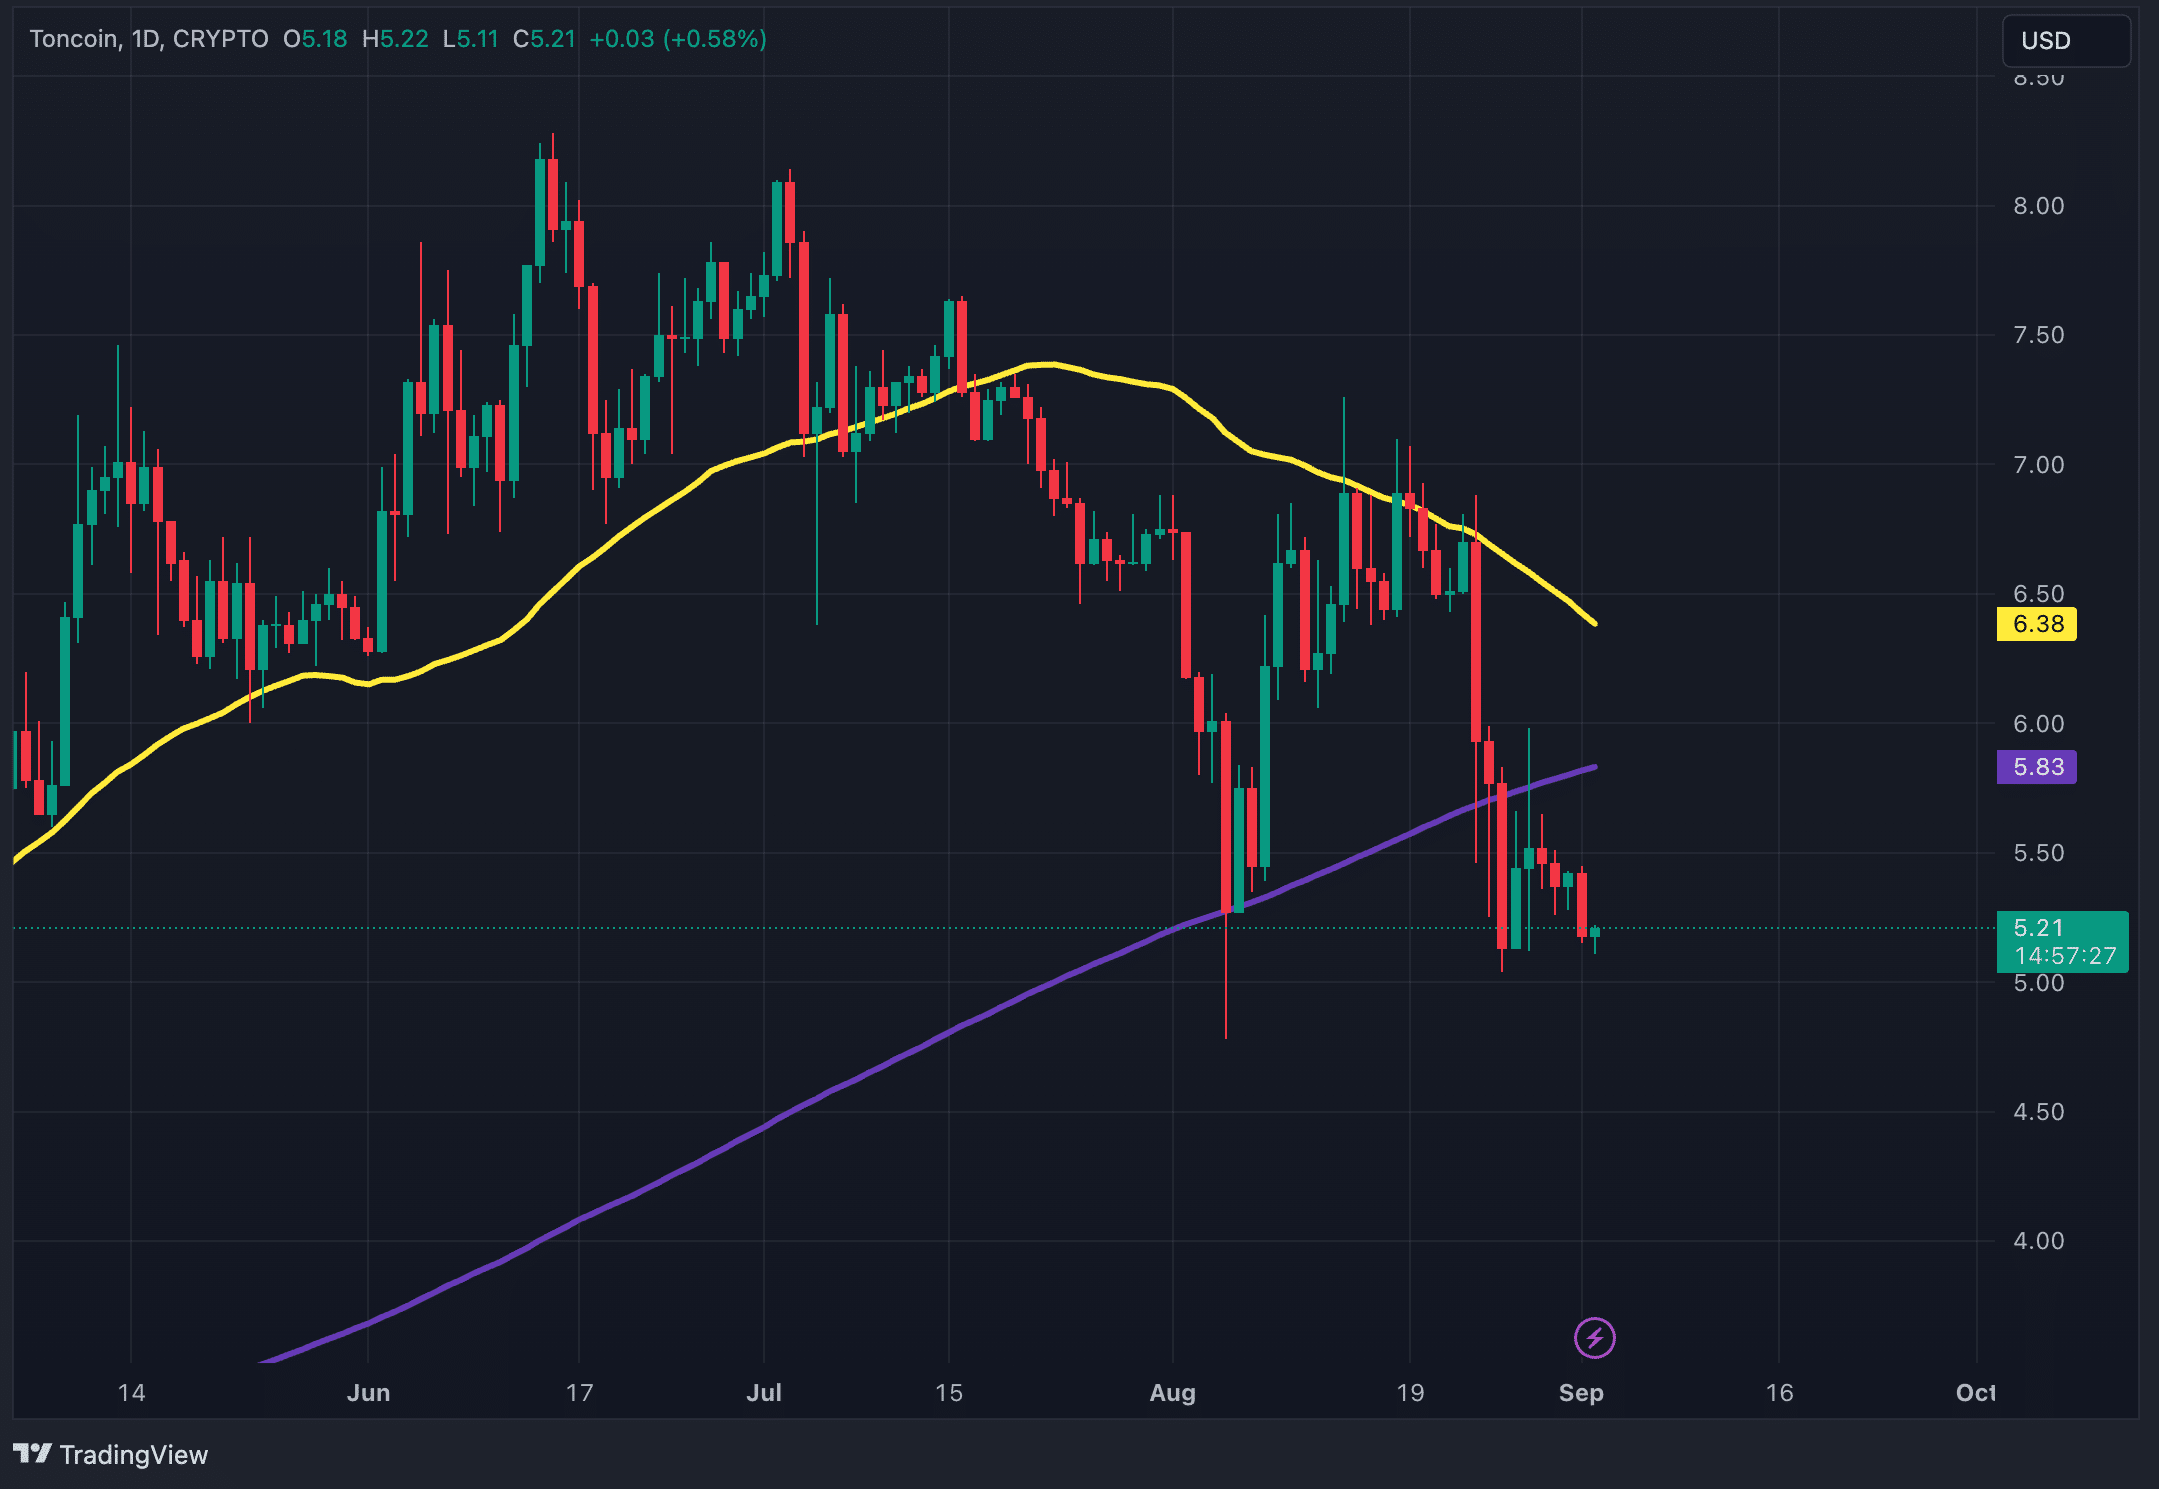
Toncoin slips below 50 and 200 MAs
Toncoin’s price fell beneath both the 50-day and 200-day moving averages (MAs) on the daily chart. The 50-day MA reflects short- to mid-term market sentiment, while the 200-day MA captures the long-term trend. A position below both indicates a sustained loss of momentum, which makes it difficult for TON to regain upward traction quickly.
Moreover, Toncoin now faces the prospect of a death cross, where the 50-day MA may cross below the 200-day MA. This is a strong bearish signal and often leads to major declines.
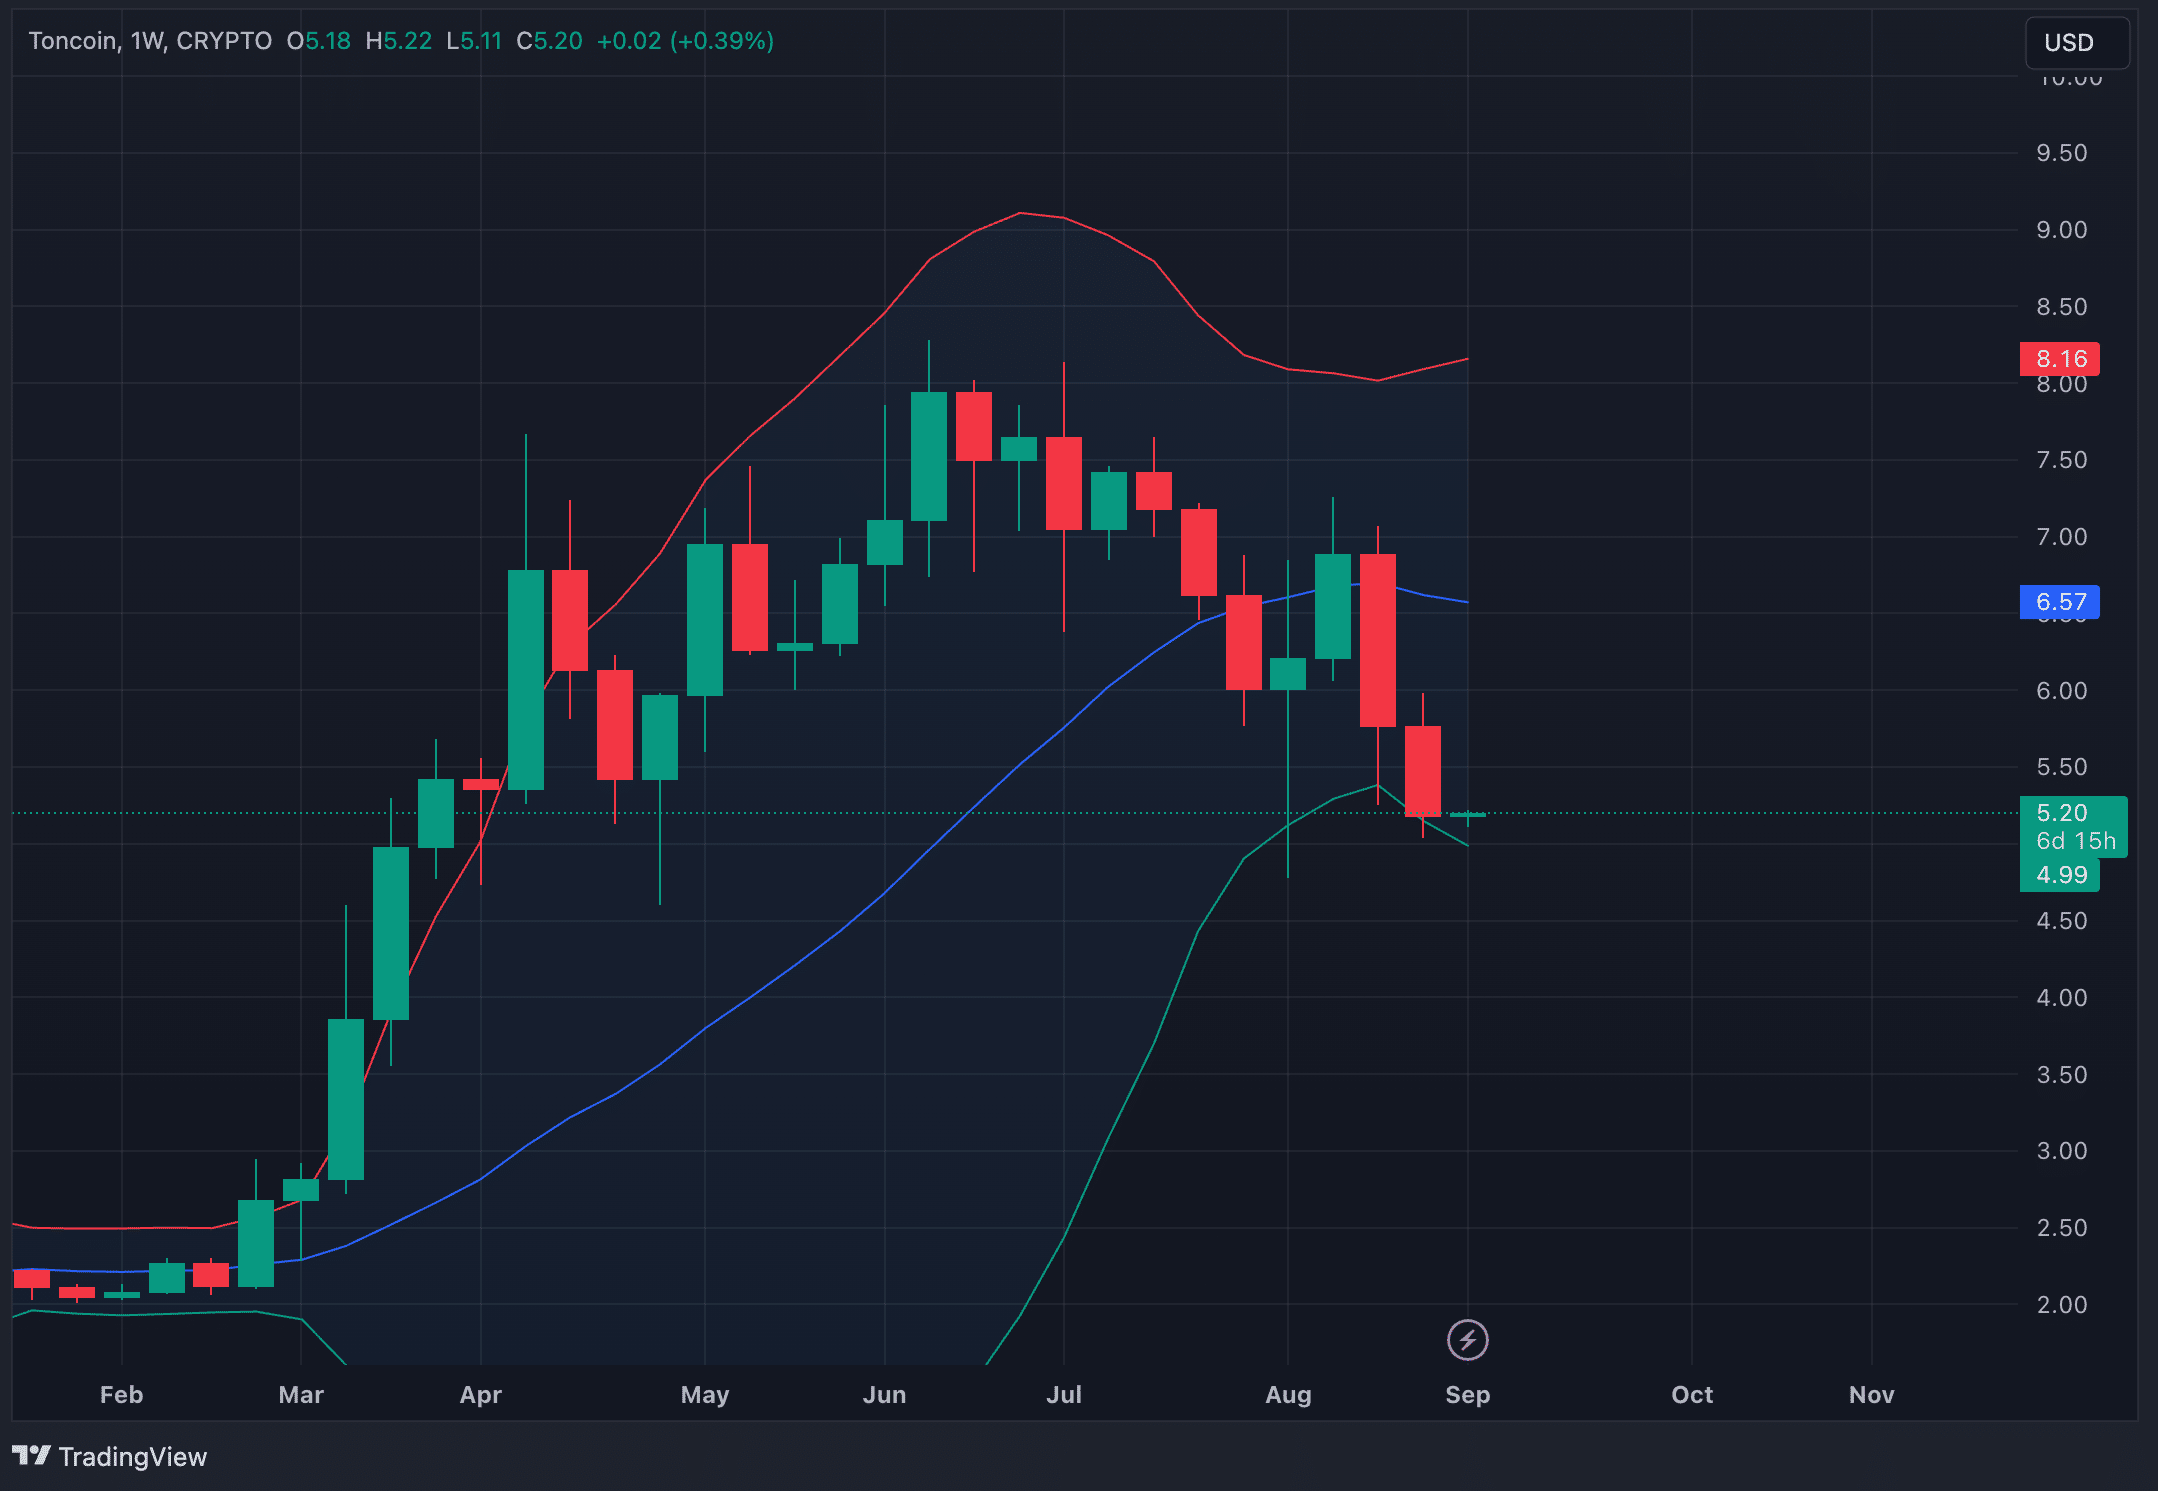
Bollinger Bands signal weakness for Toncoin
On the weekly timeframe, TON currently trades below the middle line of the Bollinger Bands and sits near the lower band. When a price is below the middle band, it suggests that the asset is underperforming relative to its recent average. And trading near the lower band indicates that the price is approaching the lower end of its expected range, signaling potentially oversold conditions.
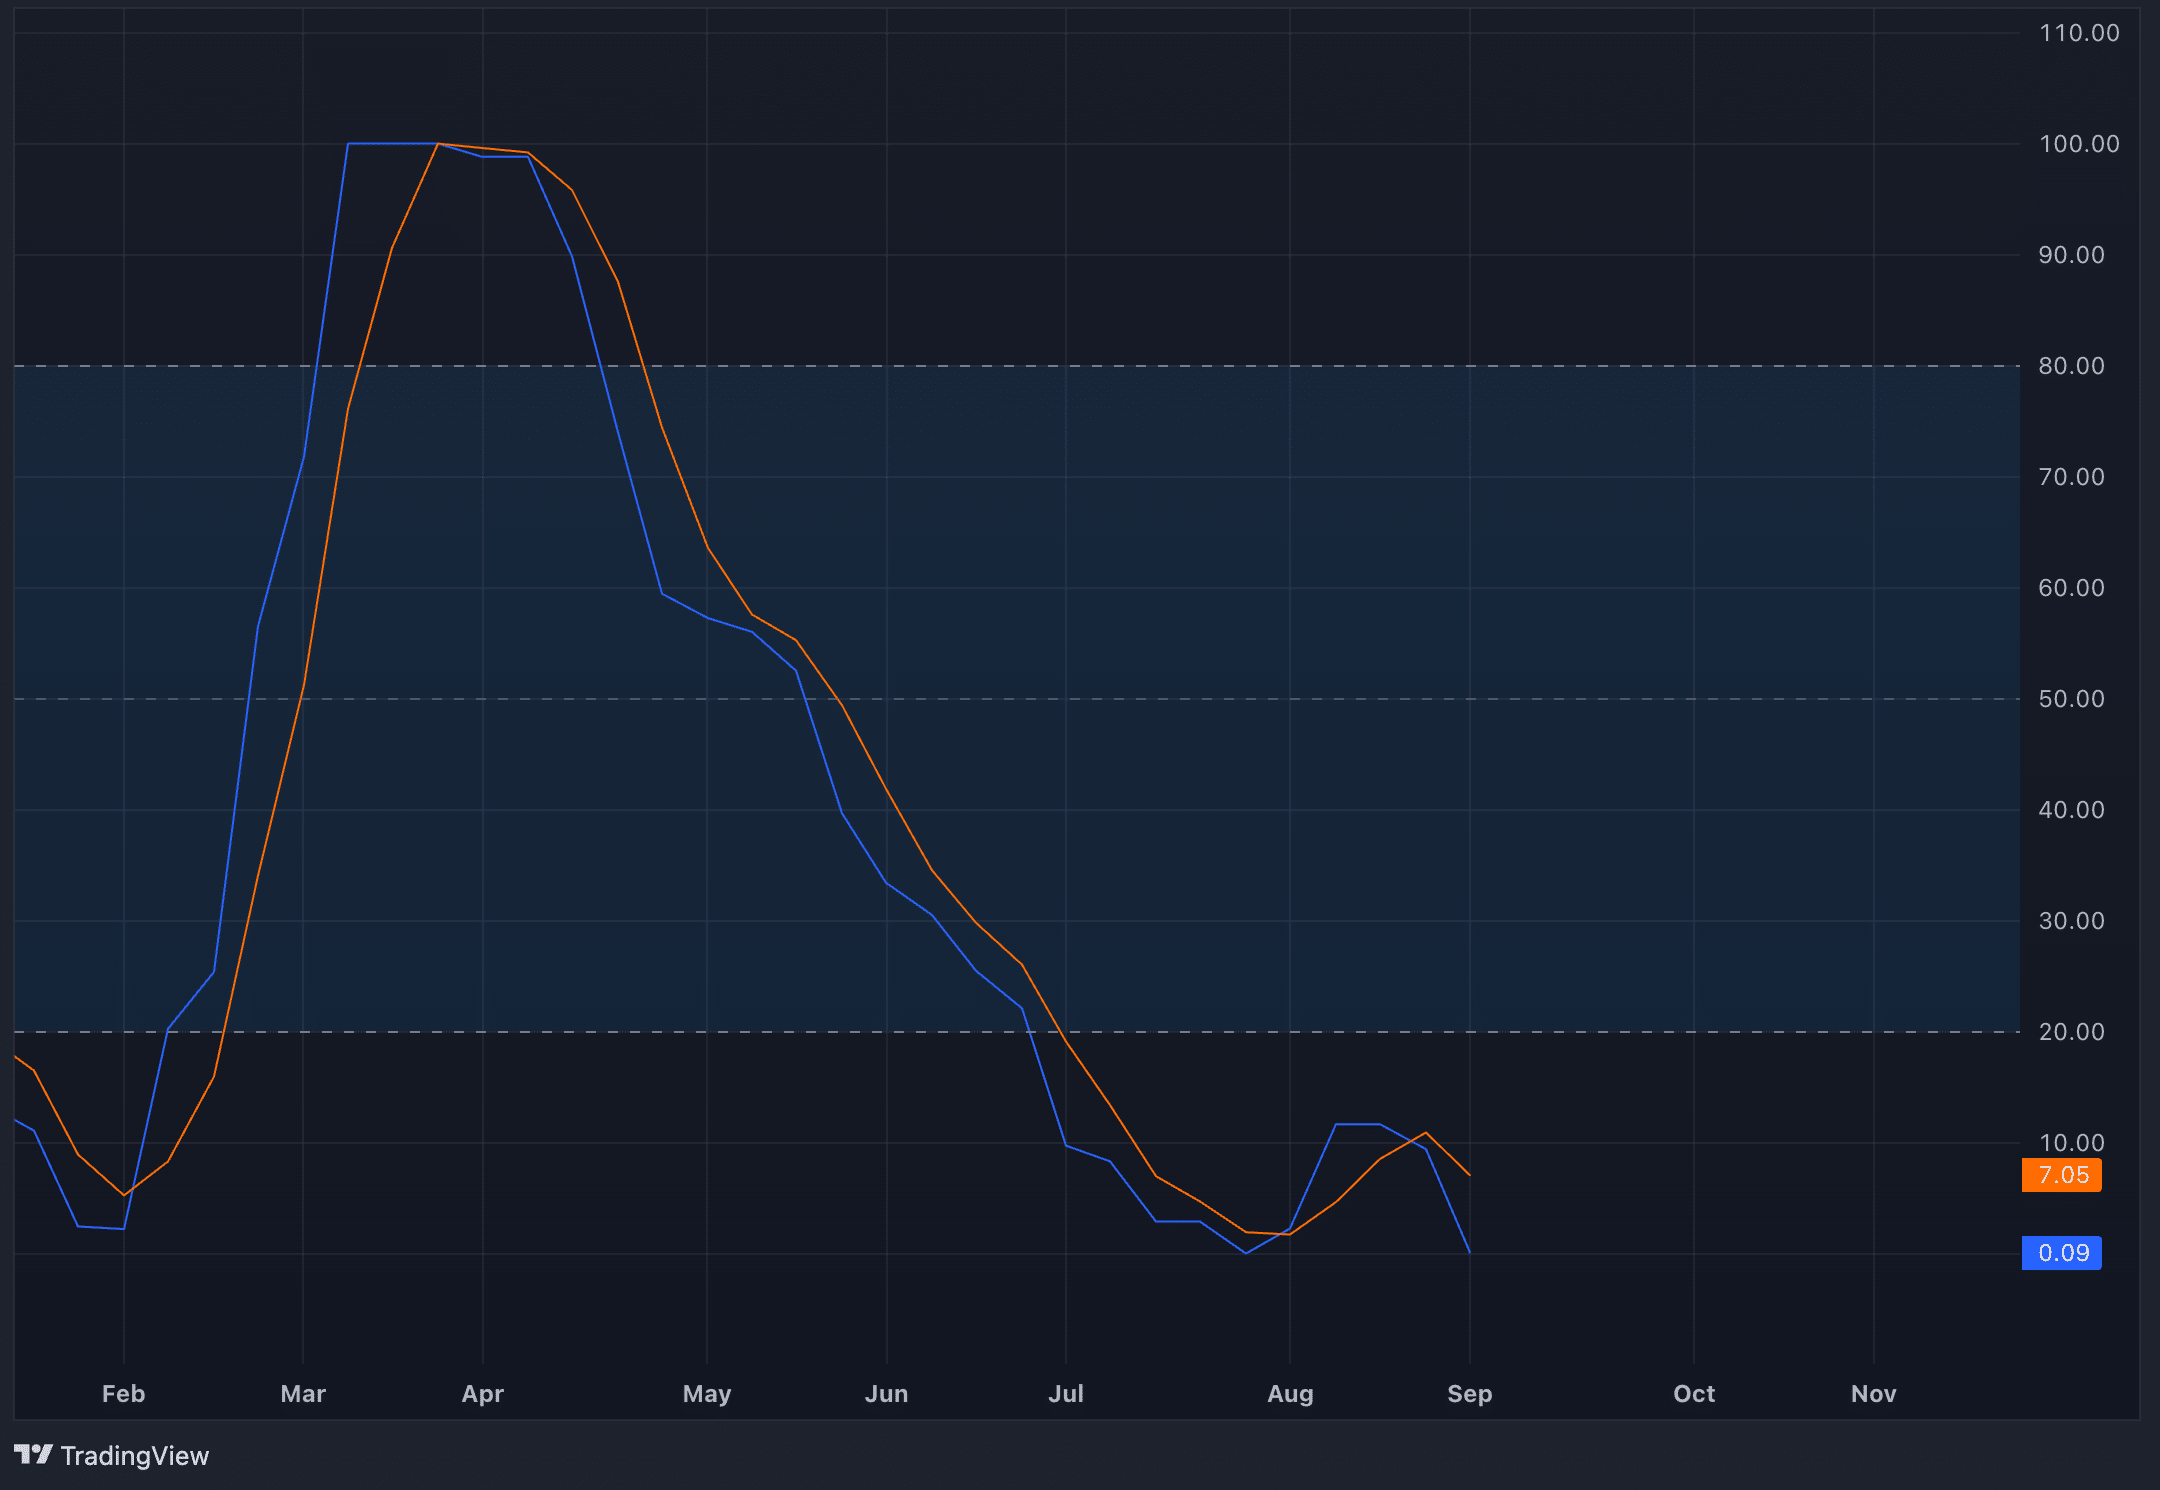
Stochastic RSI shows no relief for Toncoin
The Stochastic RSI on Toncoin’s weekly chart now sits in the oversold region, below the 20 level. In other words, the selling pressure has dominated to the point of exhaustion. Although a recent bullish crossover occurred, indicating a possible reversal, in reality, the signal proved misleading. Now, a bearish crossover has taken place, thus the downward momentum is gaining strength rather than subsiding. The implications are clear: Toncoin continues to face strong selling pressure, with little indication of a near-term recovery.
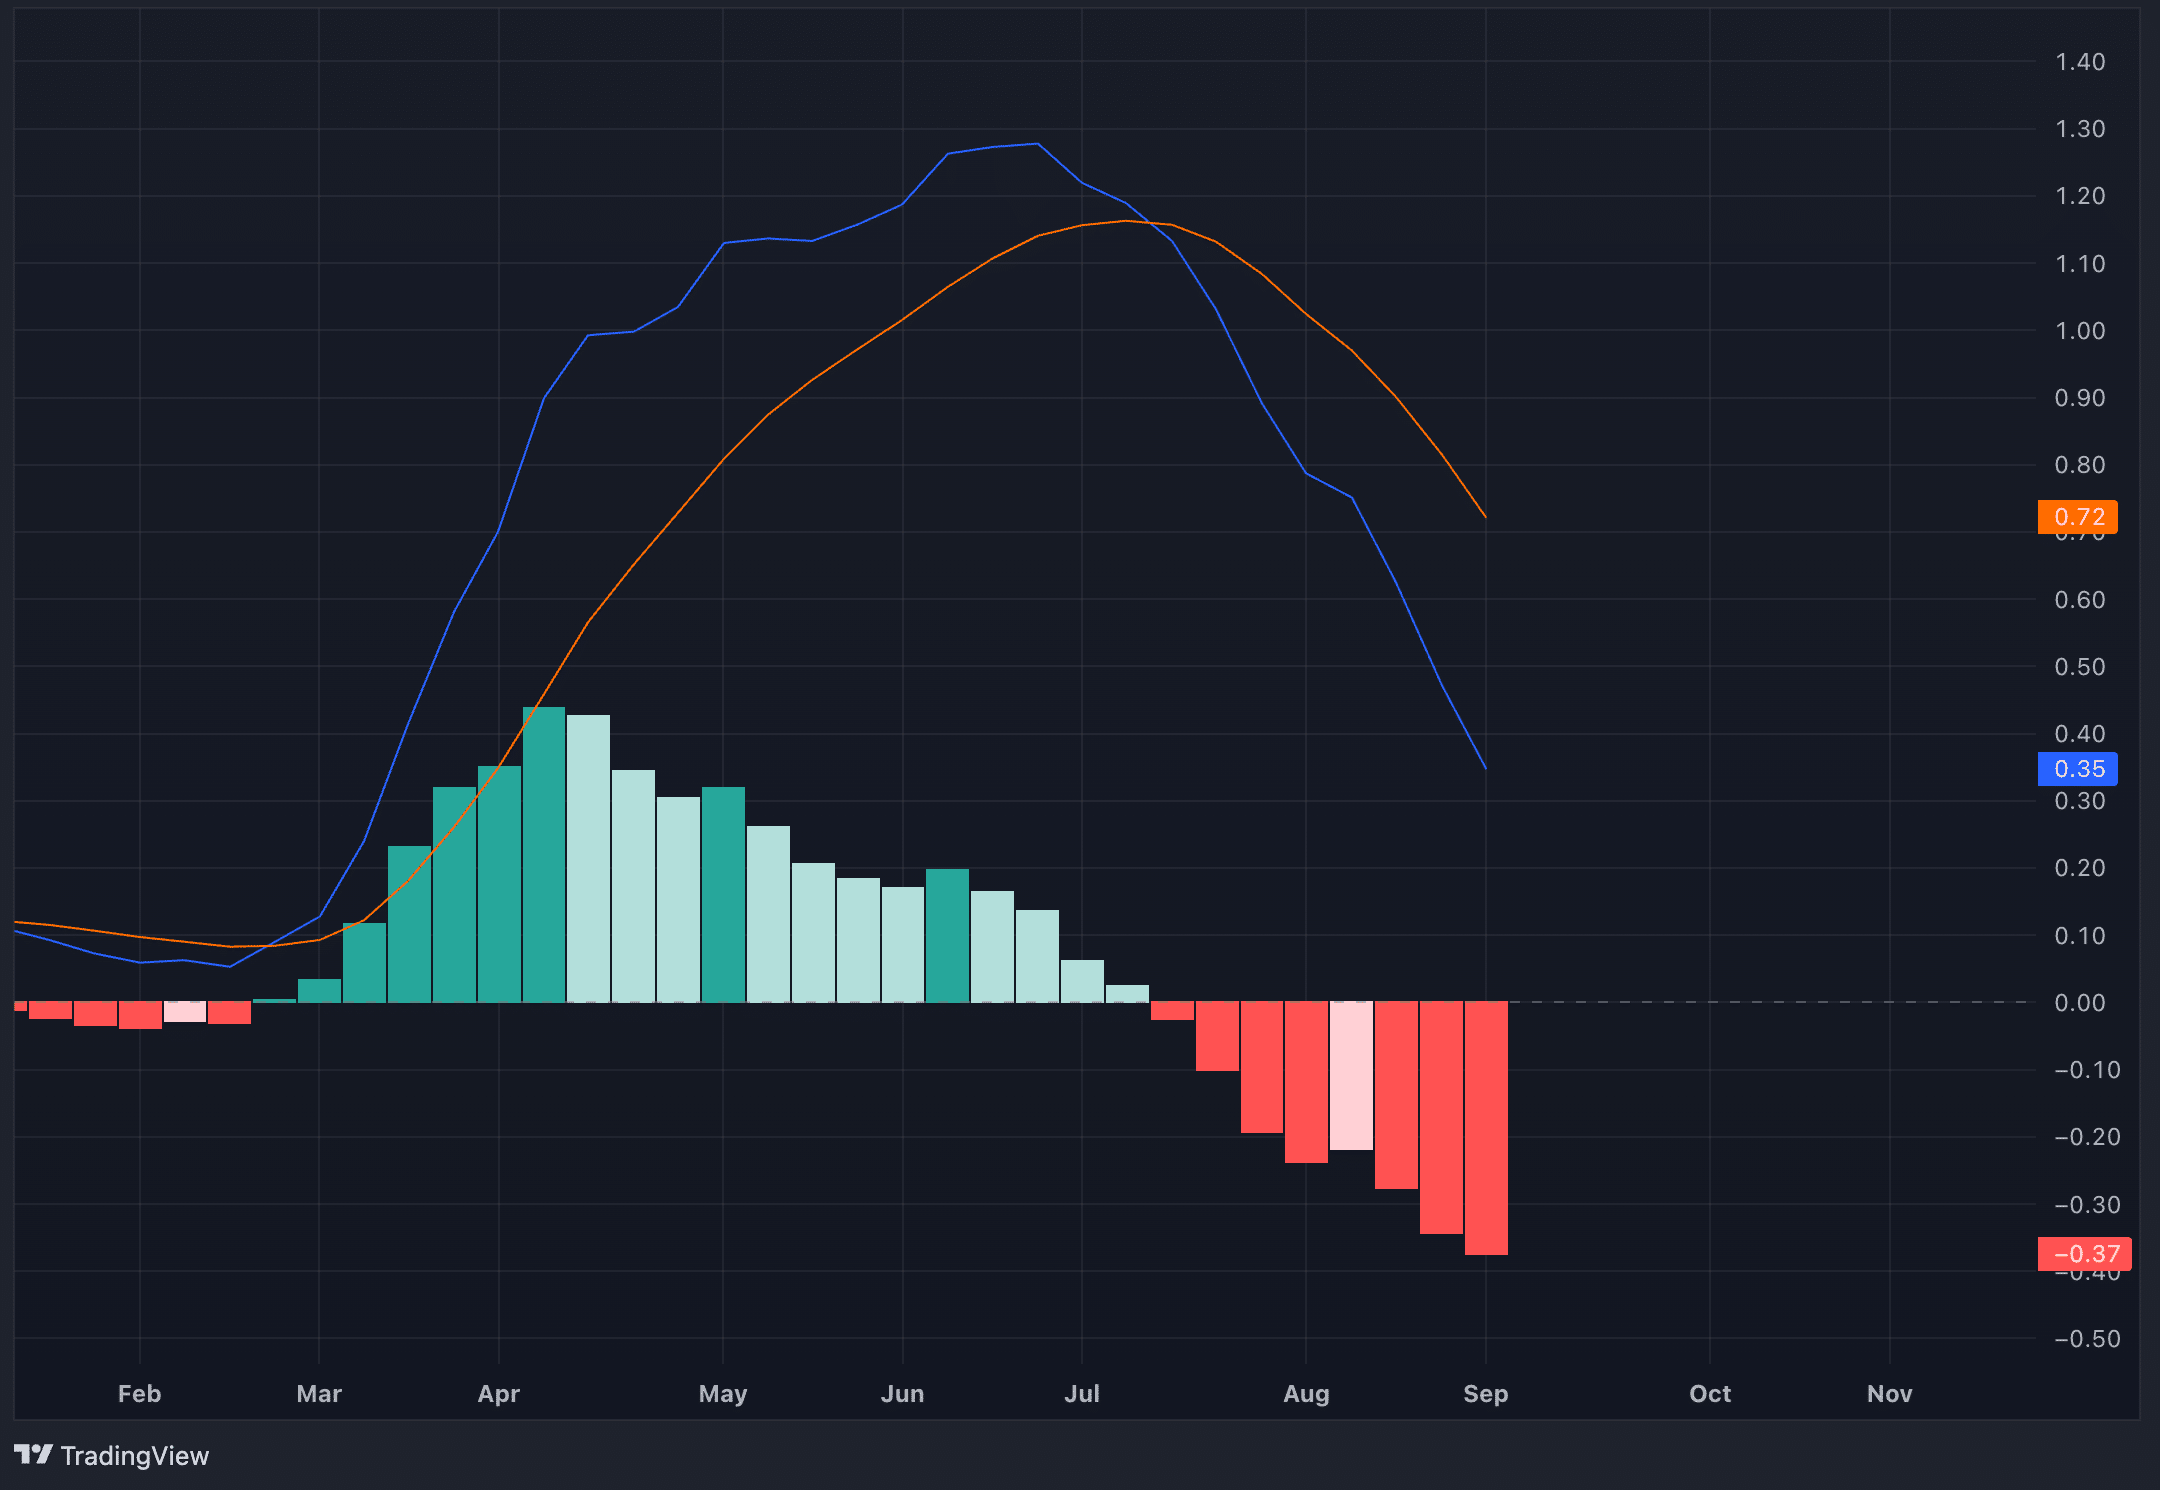
Toncoin’s MACD shows growing downward pressure
The MACD on Toncoin’s weekly chart has also confirmed a bearish signal. A bearish crossover occurred when the MACD line crossed below the signal line. The distance between the two lines has continued to widen (reflected by the expanding histogram), which indicates that the downward momentum is not just persisting but intensifying.
Toncoin’s recovery unlikely as DMI stays bearish
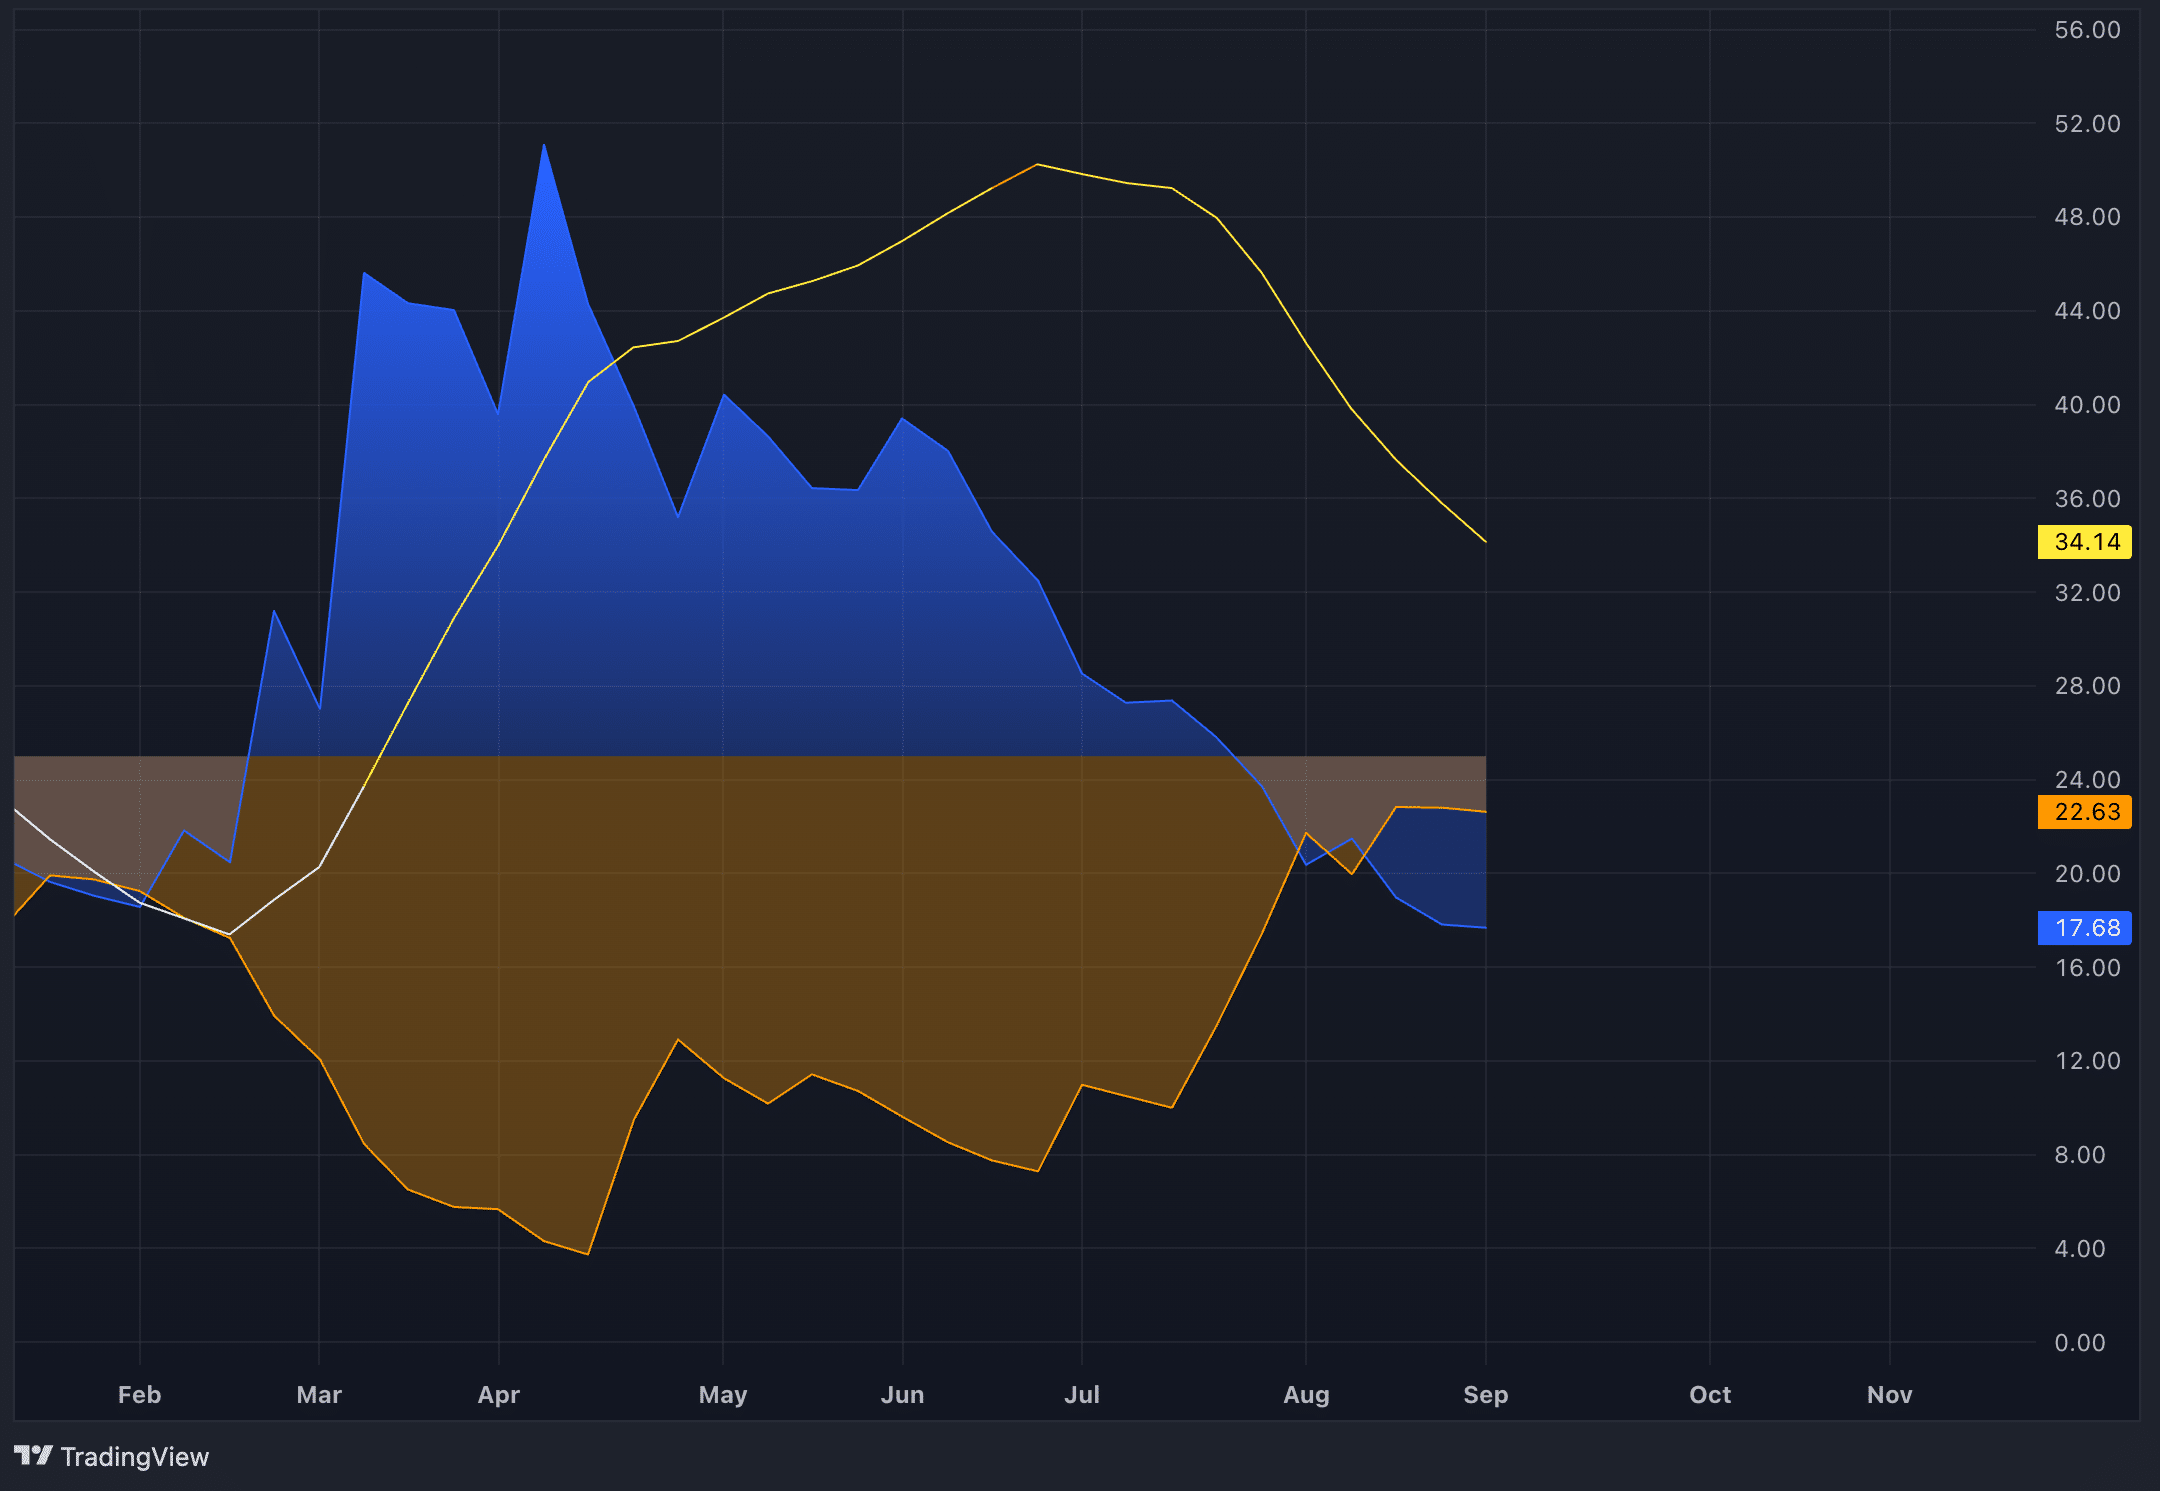
The Directional Movement Index (DMI) on Toncoin’s weekly chart also shows a clear bearish trend. The -DI (orange line) represents the strength of the downward movement and currently stays above the +DI (blue line), which signals stronger bearish momentum. The ADX (yellow line), which measures the overall strength of the trend, continues to decline, indicating of a loss of bullish momentum. The downward pressure remains firm, suggesting that Toncoin’s recovery may not materialize soon.
Closing thoughts
In addition to the technical indicators pointing to downward pressure for Toncoin, it’s crucial to consider the broader macroeconomic outlook. Although relying solely on historical performance can be misleading, patterns and external factors still provide valuable context.
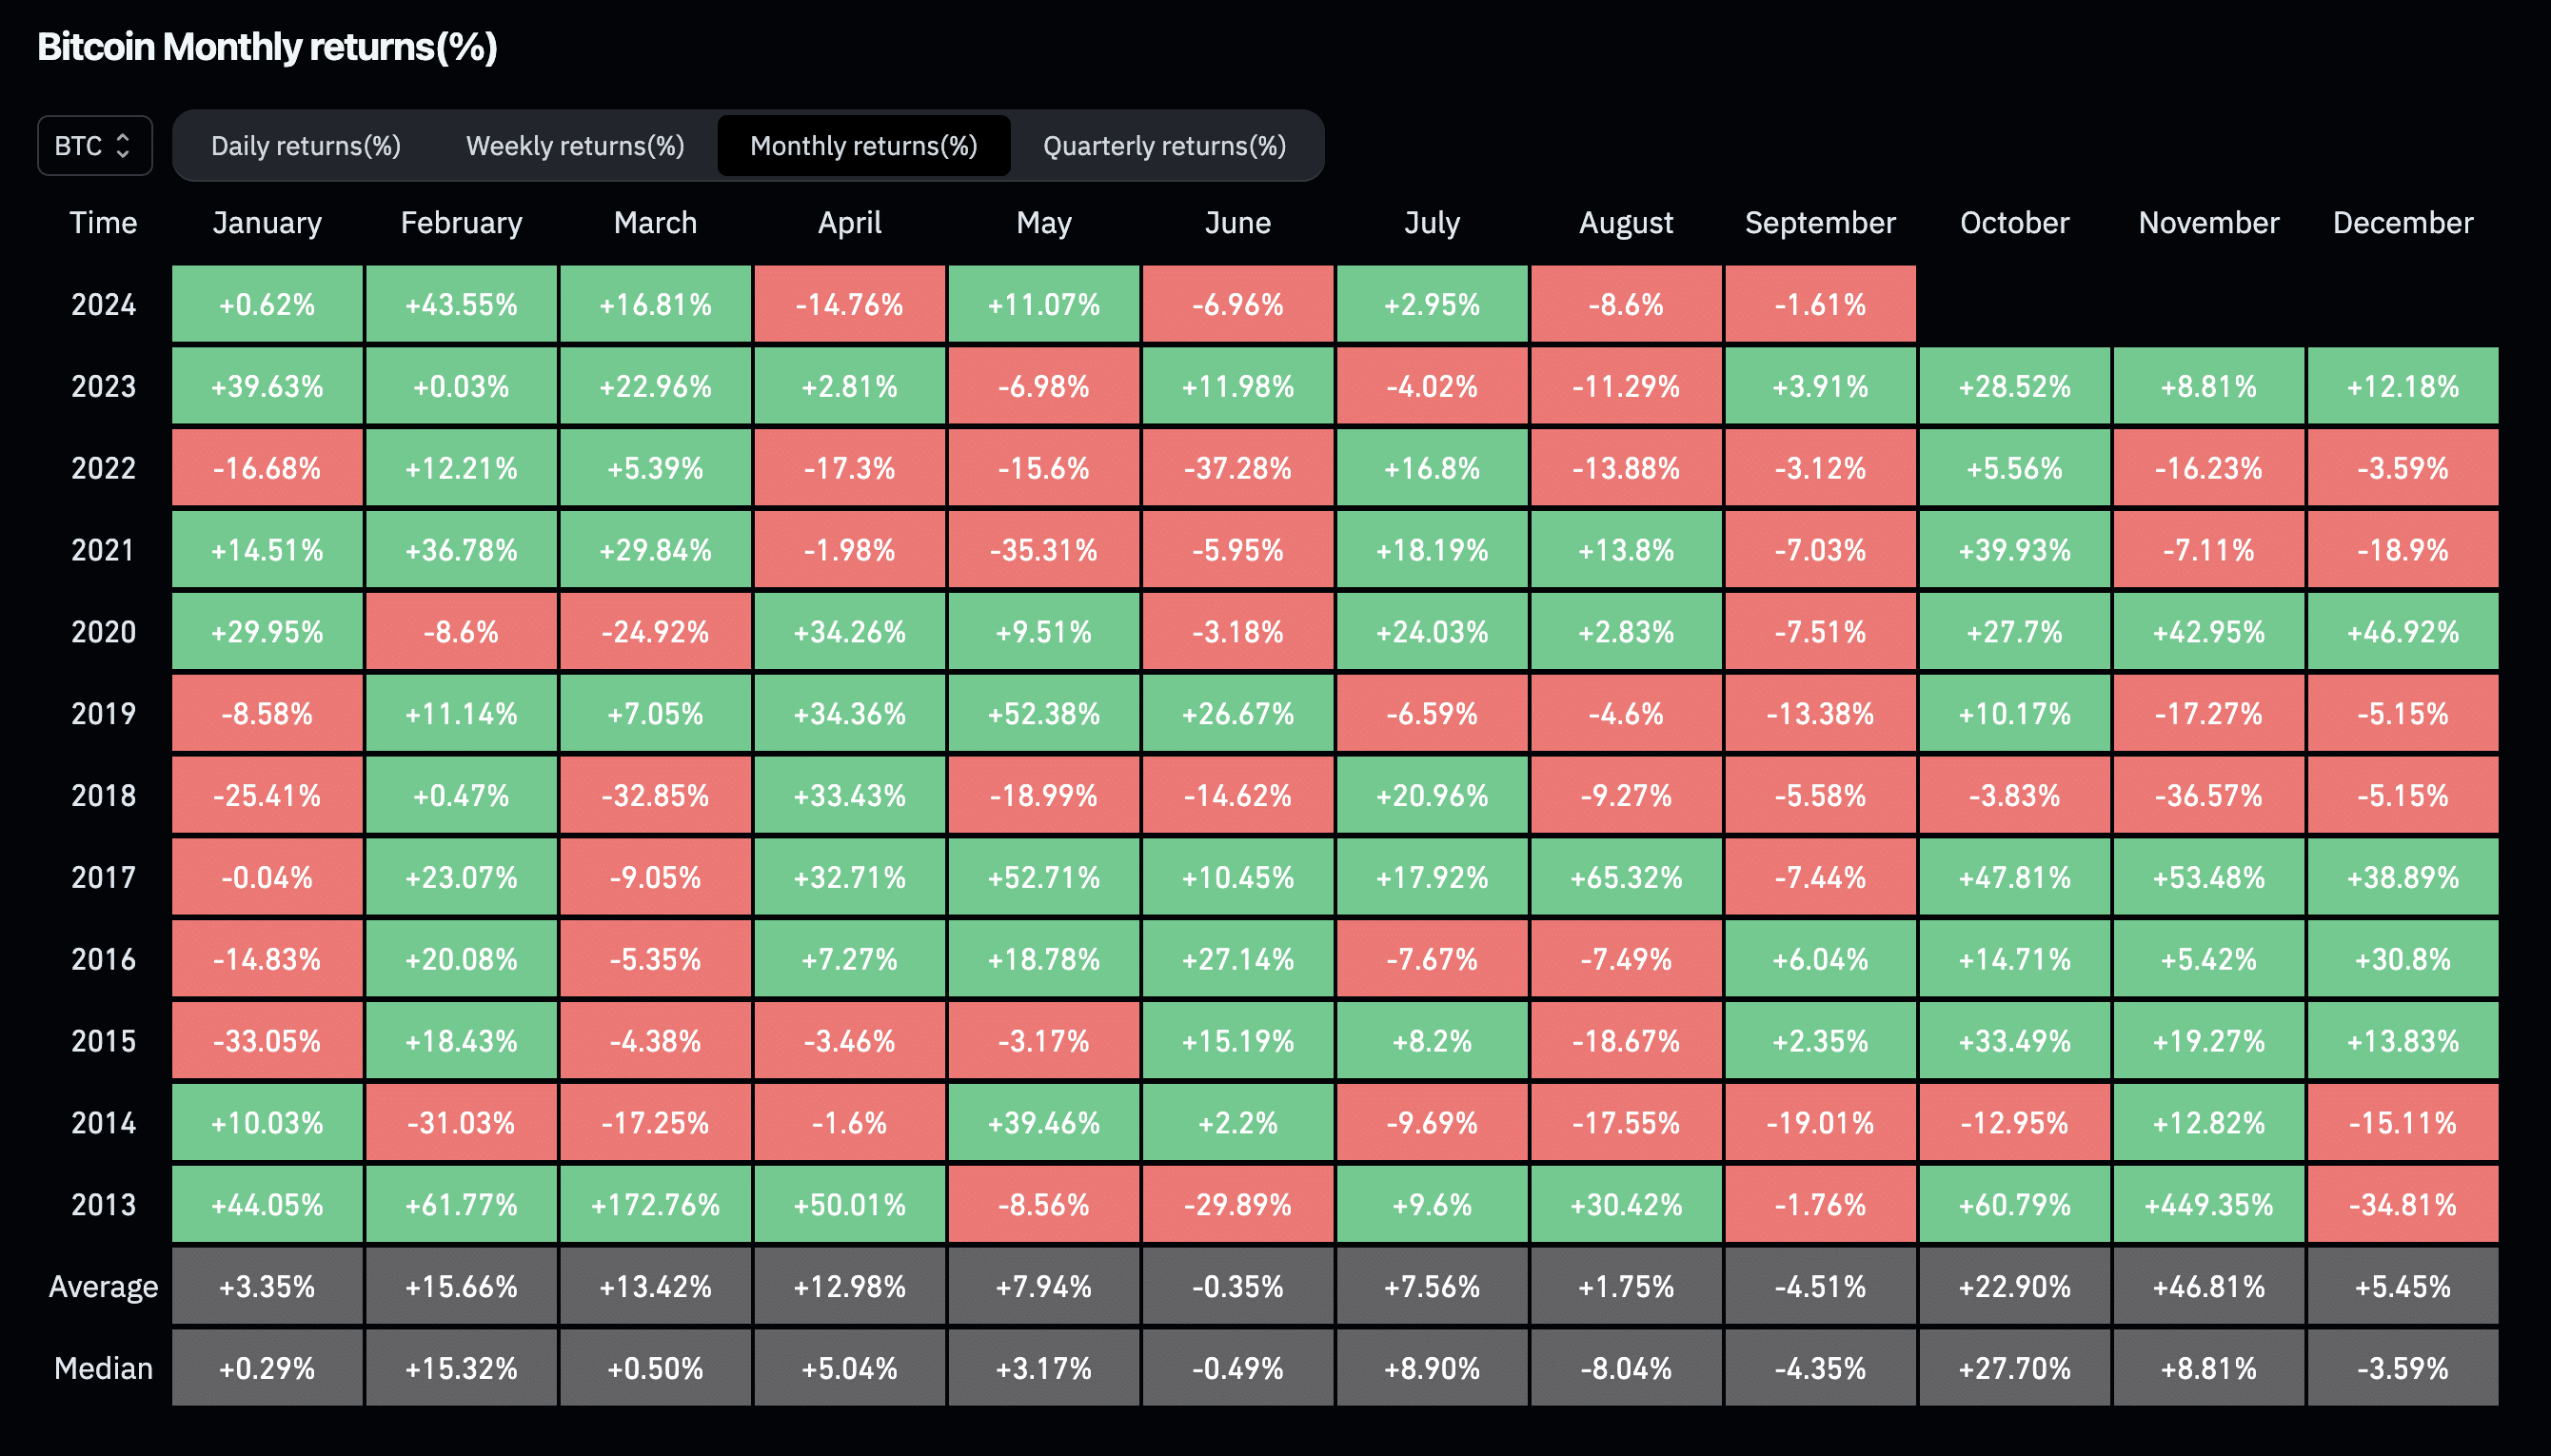
Historically, September has been a challenging month for the crypto market. Since 2013, it has ended positively only three times, while the rest have recorded losses. On average, the market has experienced a 4.51% decline in September.
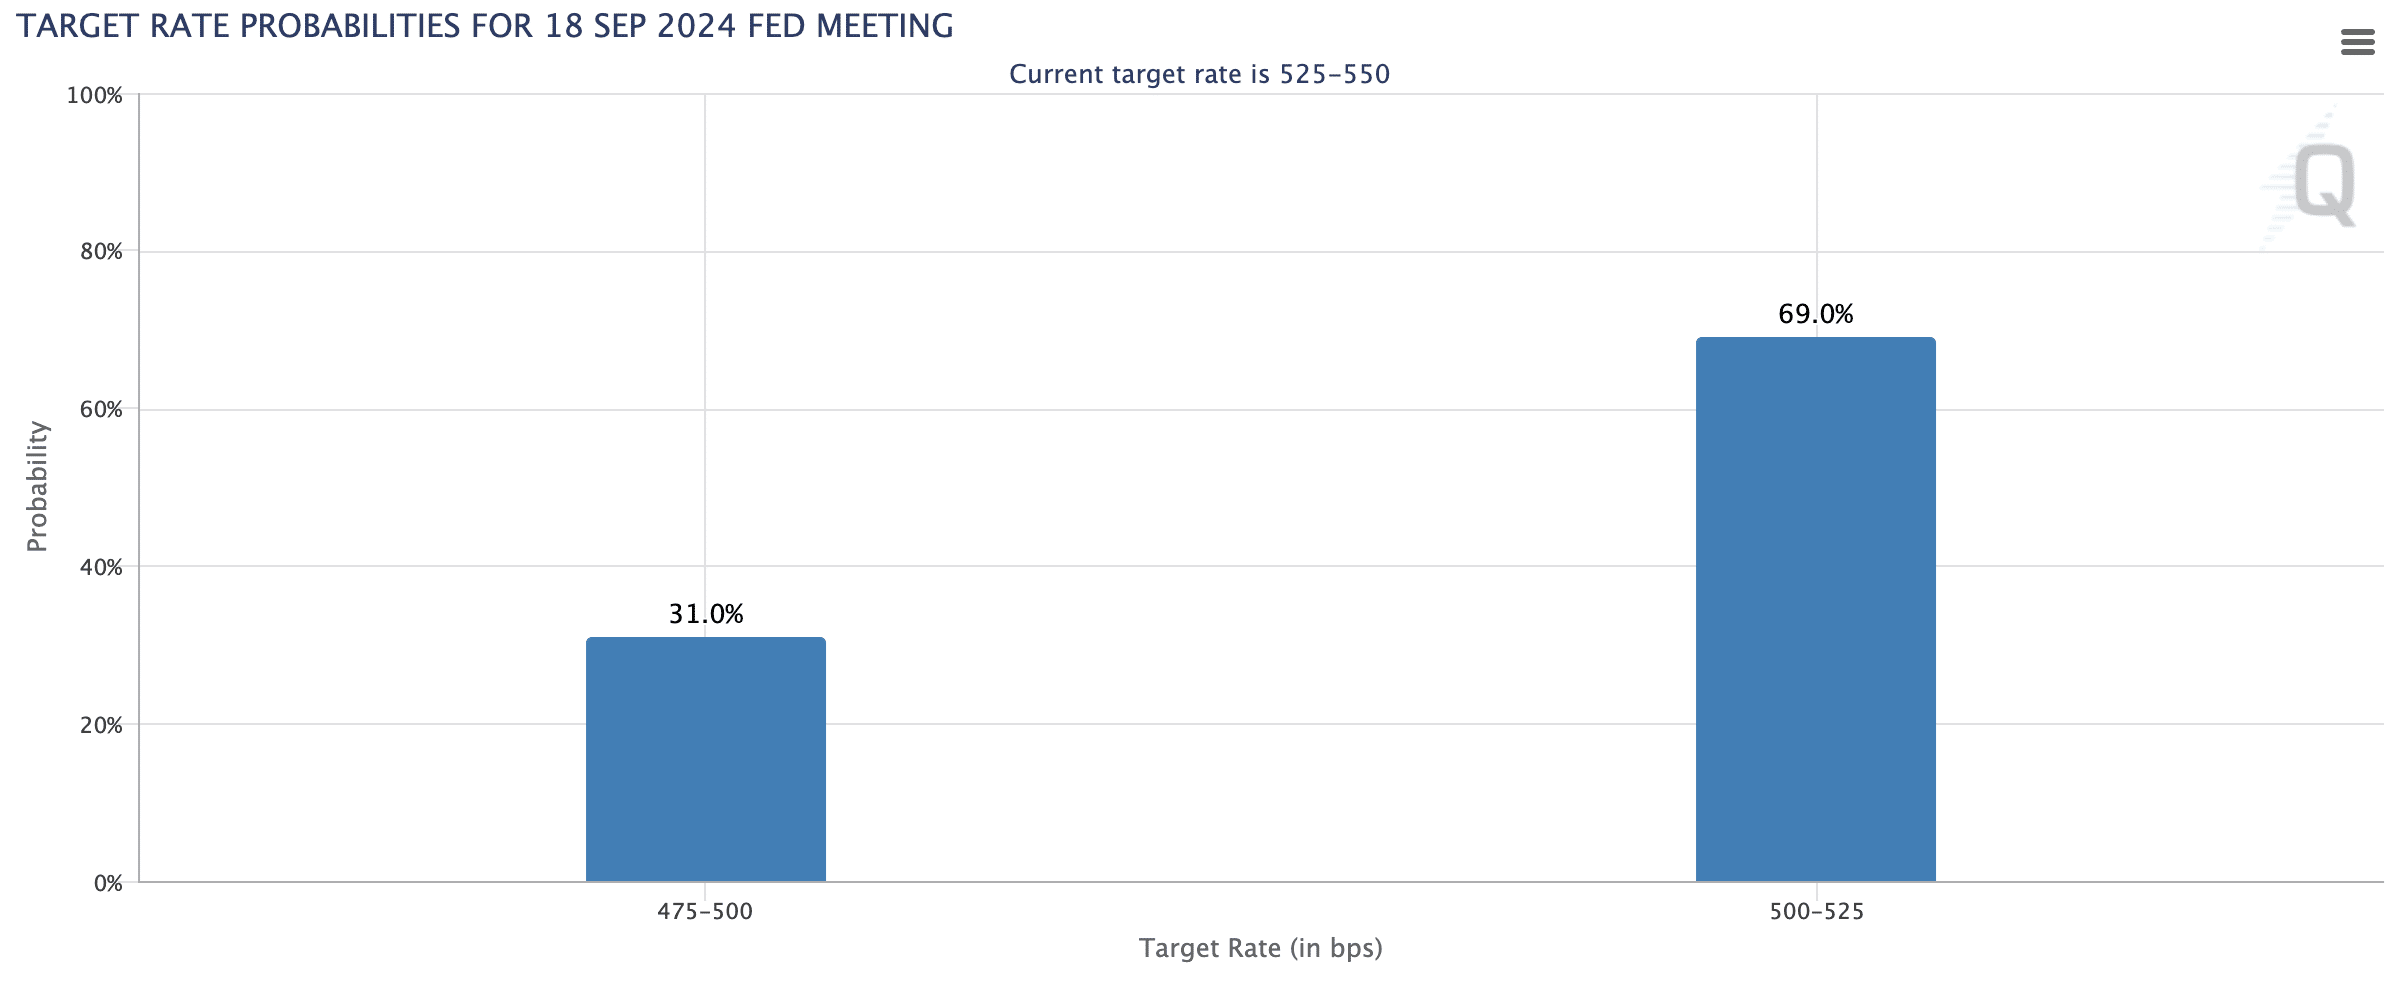
A more major concern lies in the monetary policy landscape of the United States. Looking ahead to the Federal Reserve’s September 18th meeting, the probabilities for a rate cut are non-existent, and the chances of a rate hike remain high. Federal Reserve Chair Jerome Powell’s recent statement, “The time has come for policy to adjust,” shows a likely shift in monetary policy. Historically, cryptocurrencies tend to react negatively during periods of rate cuts until the cuts stop and policy stabilizes. Given this, the broader crypto market, including Toncoin, may face further declines in the coming months before potentially transitioning into a bullish trend towards the end of 2024 and into 2025.
While historical performance does not guarantee future outcomes, these factors are essential considerations for any investor. At present, the uncertain market conditions make investments in Toncoin, Bitcoin, Ethereum, Solana, and any other cryptocurrencies particularly risky.
Disclosure: This article does not represent investment advice. The content and materials featured on this page are for educational purposes only.


