Fear, greed, and crypto: Deciphering the market’s mood swings


Can the crypto fear and greed index guide your investment decisions? Discover how this index helps you identify periods of market optimism and caution, aiding in smarter investment choices.
Table of Contents
Crypto world is like a roller coaster ride. One moment you’re soaring high, the next you’re plummeting down, and it isn’t just about numbers and charts; it’s deeply influenced by human emotions.
Think about it: when Bitcoin (BTC) prices surge, it’s not just because of some technical factors. It’s also because people feel optimistic, believing that the prices will continue to rise. Conversely, when prices fall, fear often takes over, and everyone starts selling off their assets.
Market sentiment plays a huge role in these dynamics. For instance, major cryptocurrency price movements often coincide with social media trends and news headlines. A single tweet from a well-known personality can send prices skyrocketing or crashing.
These emotional responses create cycles of fear and greed, influencing the market’s behavior. This is where the Crypto Fear and Greed Index for crypto comes into play. It acts like a thermometer, measuring the market’s emotional temperature.
So, let’s dive in and understand what the crypto fear and greed index is and why it’s so important.
What is the crypto fear and greed index?
The Crypto Fear and Greed Index is like a mood ring for the crypto market. It tells us how investors are feeling at any given moment – are they scared or greedy?
Imagine a scale from 0 to 100. When the index is low, say around 10, it means people are really scared. They are selling off their assets because they think prices will keep dropping.
On the other hand, when the index is high, around 90, it means people are feeling greedy. They’re buying up crypto like there’s no tomorrow, thinking prices will only go up.
By looking at this index, you can gauge the market’s mood and make more informed decisions. If the index shows extreme greed, it might be a good time to be cautious. If it shows extreme fear, it could be an opportunity to buy.
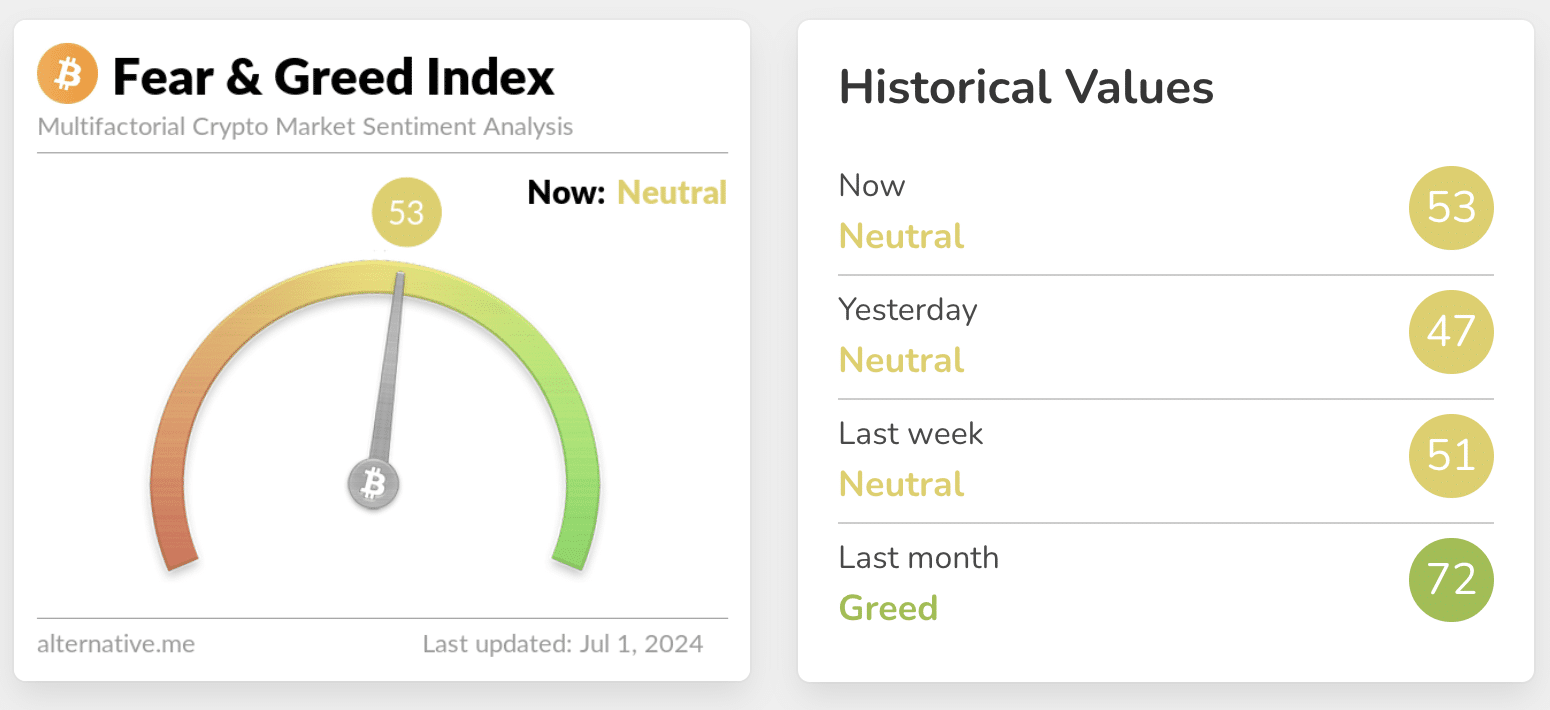
As of July 1, the index is hovering at 53, showing that sentiment is neutral, a stark contrast to levels above 70 just a month prior, indicating greed in the market. Keep in mind that this index is dynamic and can change overnight with shifting market sentiments.
How to calculate the fear and greed index
Calculating the crypto fear and greed index involves analyzing various factors that influence market sentiment. Here’s a simple breakdown of the key components and the percentage weightage given to them:
- Volatility (25%): This measures how much the price of cryptocurrencies fluctuates. If there’s a lot of volatility, it means the market is scared. For example, if Bitcoin’s price suddenly drops by 10% in a day, it indicates fear.
- Market Momentum/Volume (25%): This looks at the trading volume and the speed of price changes. High volume and rising prices suggest greed, while low volume and falling prices indicate fear.
- Social Media (15%): Sentiment analysis from social media platforms like Twitter is another crucial factor. Tools scan thousands of posts to see if people are talking positively or negatively about crypto.
- Surveys (15%): Regular polls and surveys gauge how investors feel about the market. Are they bullish or bearish? The conducting website says this method is on pause as of June 28.
- Dominance (10%): This measures the market share of Bitcoin compared to other cryptocurrencies. If Bitcoin’s dominance is rising, it suggests fear as investors move to the more stable asset. If it’s falling, it indicates greed, as investors are willing to take more risks with altcoins.
- Trends (10%): Google search trends for terms like “Bitcoin” or “crypto scam” can also indicate market sentiment. A spike in searches for “crypto scam” usually signals fear, while rising searches for “Bitcoin” might indicate greed.
Each of these factors is given a weight (given in the bracket) and then combined to produce the final index score. This score helps investors understand the current market sentiment and make better decisions based on whether the market is driven by fear or greed.
History of the crypto fear and greed index
The Crypto Fear and Greed Index has become a vital tool for understanding market sentiment. It was first introduced in 2018 by Alternative.me, aiming to provide investors with a snapshot of the crypto market’s emotional state.
In its early days, the index reflected the immense volatility that characterized the crypto market. For example, during the 2018 bear market, the index frequently hovered in the “Extreme Fear” zone.
During this period, Bitcoin’s price fell from nearly $20,000 in December 2017 to below $4,000 by the end of 2018, marking a period of prolonged fear that discouraged many investors and highlighted the index’s ability to capture market pessimism.
Fast forward to 2020, the onset of the COVID-19 pandemic caused widespread fear across global markets, including crypto. The index plummeted to its lowest levels as Bitcoin’s price dipped below $4,000 in March 2020.
However, as the year progressed and stimulus measures were introduced, optimism returned. By the end of 2020, Bitcoin’s price surged past $20,000, and the index reflected “Extreme Greed,” showing a stark shift in sentiment.
In 2021, the index saw extreme highs and lows. During the first half of the year, Bitcoin reached a high of over $64,000 in April, driven by institutional adoption and positive news. The index hit “Extreme Greed,” with values consistently above 70.
However, the subsequent market correction in May 2021 saw the index swing back to “Extreme Fear” as prices halved and concerns over regulatory crackdowns grew.
Then, in 2023, the index continued to illustrate the crypto market’s sensitivity to news and events. For example, the collapse of several crypto exchanges and regulatory actions led to sharp declines in the index, showing heightened fear. Conversely, positive developments like the approval of Bitcoin ETFs brought back greed.
In March 2024, this index reached a level of 90, indicating extreme greed as Bitcoin reached a new all-time high of $73,750. Since then, it has been declining and is currently sitting in the neutral zone.
How to use the crypto fear and greed index
The Crypto Fear and Greed Index can be a powerful tool for making informed investment decisions.
When the index shows “Extreme Fear,” it can signal a potential buying opportunity. This is because fear often leads to lower prices, presenting a chance to acquire assets at a discount.
Conversely, when the index indicates “Extreme Greed,” it might be a good time to exercise caution. High greed levels often precede market corrections, suggesting that prices could be inflated and due for a pullback.
Practical tips for using the crypto fear and greed index
To effectively use the Crypto Fear and Greed Index, follow these practical tips:
- Combine with other Indicators: Use the index alongside other technical and fundamental analysis tools for a more comprehensive view of the market.
- Set thresholds: Establish specific index values that will trigger actions. For example, you might decide to consider buying when the index falls below 20 (extreme fear) and consider selling when it rises above 80 (extreme greed).
- Monitor regularly: Check the index daily or weekly to stay updated on market sentiment trends. This will help you react promptly to changing conditions.
- Stay Informed: Keep an eye on news and social media trends that can impact the index. Major events, regulatory news, or influential social media posts can cause crucial shifts in sentiment.
- Avoid emotional decisions: Use the index as a tool to remain objective. It helps to counteract the emotional biases that can cloud judgment during extreme market conditions.
Limitations and criticisms
While the Crypto Fear and Greed Index is a valuable tool, it has its limitations and criticisms.
One major limitation is that it relies heavily on social media and news sentiment, which can be highly volatile and sometimes misleading. The index might overreact to short-term events that don’t have a lasting impact on the market.
Additionally, the index doesn’t account for broader economic factors that can influence the crypto market, such as changes in interest rates or macroeconomic trends.
Critics also point out that the index can sometimes be a self-fulfilling prophecy. When investors see extreme fear or greed readings, they might act in ways that exacerbate market movements, leading to increased volatility.