Why is XRP price at risk of falling to December lows?


XRP price extended its losing streak to a sixth day on Wednesday as waning institutional appetite and a sector-wide sell-off pushed prices below the critical $2.00 support level.
- XRP price has lost the $2 key psychological support level after dropping 11% over the past week.
- XRP ETFs lost their seven-day inflow streak on Tuesday.
- Technical indicators are signalling a bearish outlook for the short term price trajectory.
According to data from crypto.news, XRP (XRP) price lost its key psychological support at $2 earlier this week, mirroring the general performance of the crypto market in general. The fifth-largest crypto asset is down 11.2% over the last seven days, a decline that extends to 20% when measured from its highest point this month.
XRP’s recent weakness largely stems from ongoing jitters in the crypto market amid growing U.S. and EU trade concerns revolving around a dispute over Greenland. It was further compounded by news that a widely anticipated critical U.S. crypto market structure bill, known as the CLARITY Act, has faced further delays in the Senate.
As a result of these headwinds, demand for the token has waned. Data from SoSoValue shows that the five U.S. XRP ETFs saw a combined $53.3 million in net outflows, ending their seven-day streak that drew in nearly $70 million into the investment products.
Investors appear to be shifting toward a risk-off stance while they wait for more definitive signals from both global trade negotiations and the legislative process in Washington. At press time, the Crypto Fear and Greed Index had entered extreme fear territory after dropping 8 points over the past day to 24.
Cryptocurrencies typically enter a very bearish phase of capitulation or heightened selling pressure when this metric shows such low levels.
XRP price analysis
On the daily chart, XRP price has fallen below a multi-month descending trendline that has been acting as a key level of support and resistance during recent price swings. It has also lost the horizontal support level at $2, which has historically served as a psychological anchor for investors and a major pivot point for market sentiment.
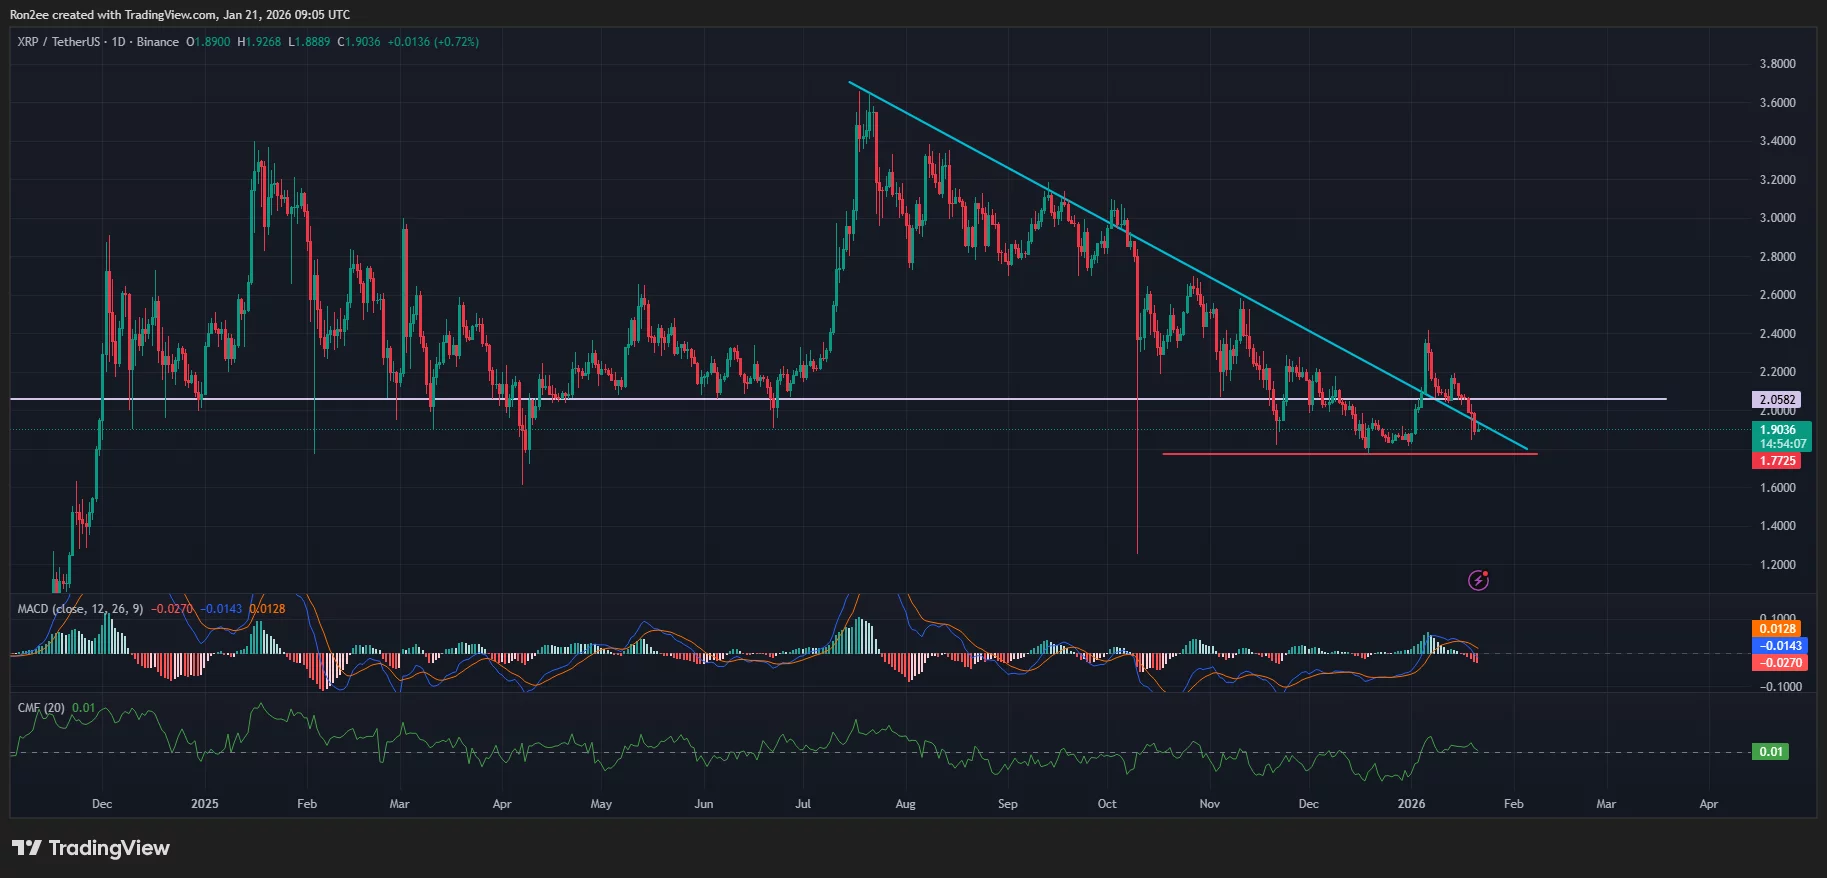
Looking at other technical indicators also seems to show that bears are currently at an advantage. The MACD lines have formed a bearish crossover and are eyeing a move below the zero line, while the Chaikin Money Flow index, which gauges the volume of institutional money entering or leaving the asset, is close to moving into a negative reading.
Hence, XRP is likely to test its next key support at the December low of $1.77 over the coming days.
However, the bearish technical outlook is complicated by robust growth in the network’s core use cases. Specifically, XRP is gaining significant ground in RWA tokenization and stablecoin infrastructure. Monthly data reveals a 27% surge in RWA-linked value, now exceeding $400 million, alongside an 11% increase in stablecoin market capitalization on the XRPL network.
Consequently, while the immediate path of least resistance appears lower, a sustained close back above the $2.00 pivot point could signal that the fundamental narrative is beginning to outweigh the technical pressure.
Disclosure: This article does not represent investment advice. The content and materials featured on this page are for educational purposes only.