Will Bitcoin price crash to $60k as bearish double top coincides with 5-week ETF outflows streak?


Bitcoin price has formed a highly bearish pattern that hints at a potential crash to $60K as both institutional and retail confidence continued to erode in the legacy crypto asset.
- Bitcoin price is at risk of more downside after forming multiple bearish patterns.
- Searches for “Bitcoin going to zero” have hit an all-time high.
- Nearly $4 billion has left spot Bitcoin ETFs over past 5-weeks.
According to data from crypto.news, Bitcoin (BTC) price fell to an intraday low of around $65,700 on Thursday before bouncing back above $67,000 at press time. At this price, it remains 15% below its February high and down over 46% below its all-time high.
Multiple bearish patterns form on Bitcoin chart
On the daily chart, the bellwether asset’s price action appears to have formed multiple bearish patterns.
Notably, Bitcoin price has charted a double top pattern, which is one of the most popular bearish patterns in technical analysis. Such a formation with two rounded tops has typically been marked with a downside equal to the height of the peaks from the neckline.
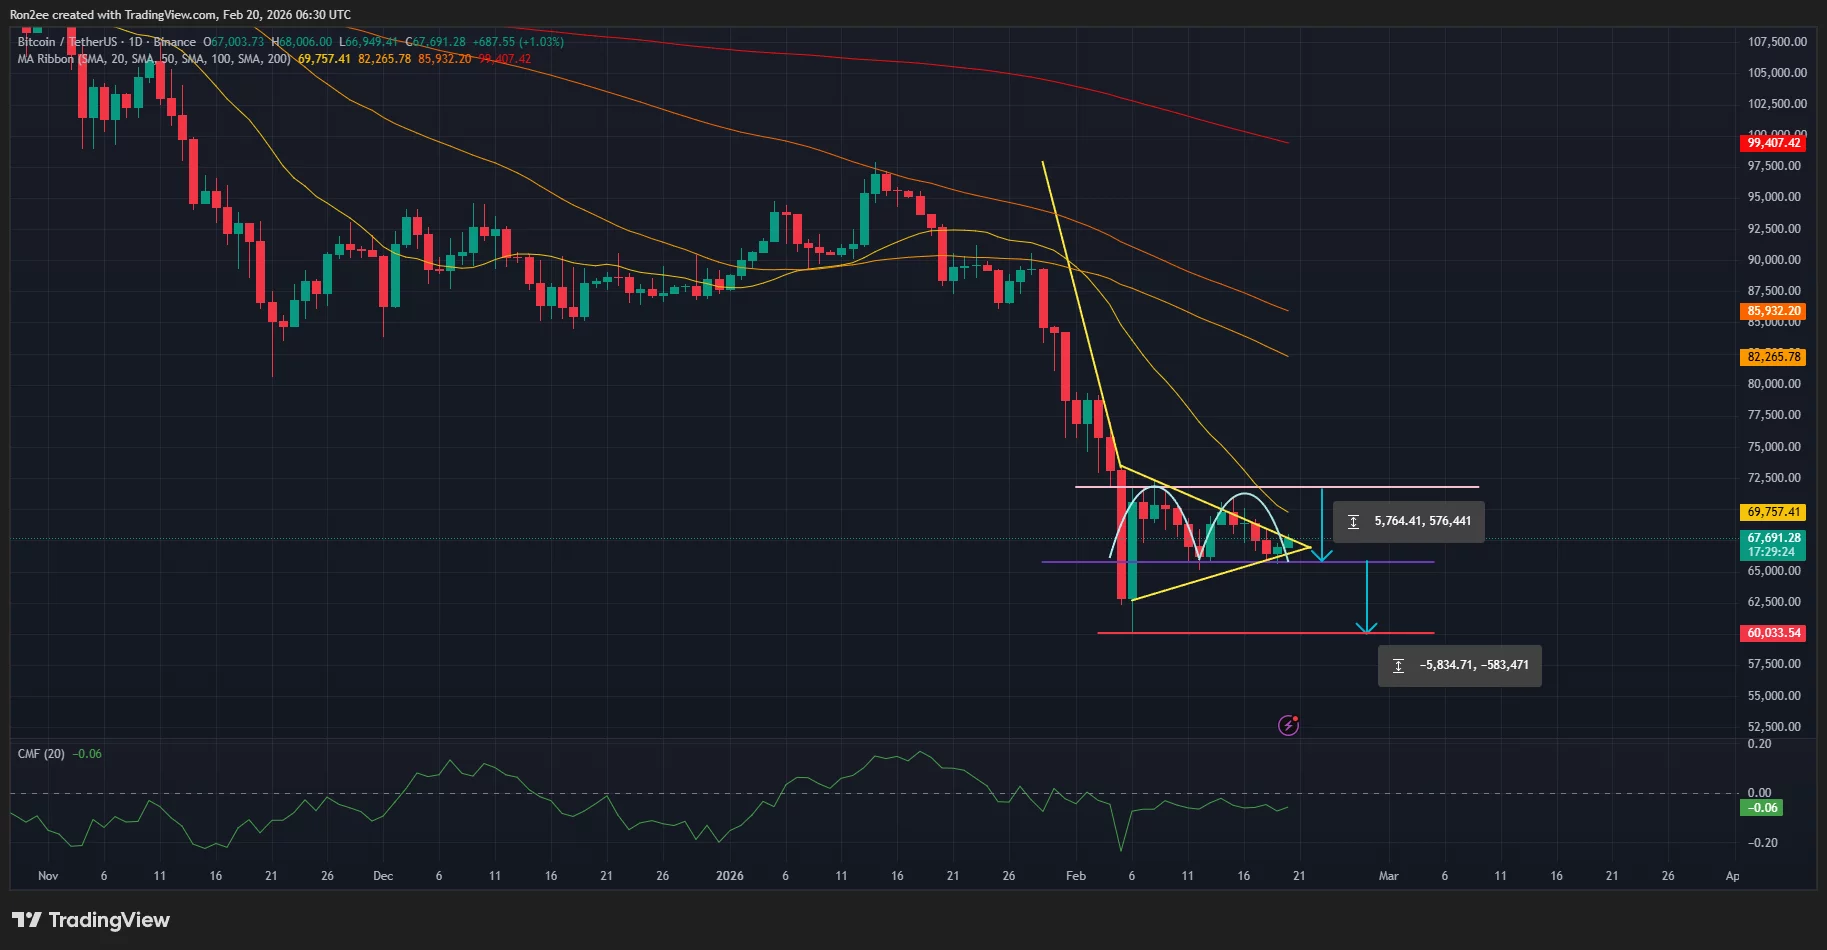
Bitcoin price has also formed a bearish pennant pattern, which appears like an inverted flagpole and is also another bearish signal indicating further continuation of the trend.
The convergence of both these bearish patterns at the same time significantly increases a bearish outlook for the asset in the coming sessions.
Adding to this, Bitcoin price currently lies below all of the key moving averages with a bearish crossover between the 20-day and 50-day SMA at play. Meanwhile, the Chaikin Money Flow index has also printed a negative reading of -0.06 at press time, suggesting capital outflows away from its market, a metric that suggests selling pressure is building across the board.
Hence, the path of least resistance points to a bearish prediction for Bitcoin, where bears could try to push the token price down towards the $60,000 mark, a level that is calculated by subtracting the height of the double tops formed from the breakout point.
Breaking below this key psychological support could position Bitcoin for a steeper drop towards $50,000.
Market sentiment shows heavy bearish overhang
The bearish narrative gains strength from the fact that retail sentiment already appears to have taken a negative turn.
According to Google Trends data, global searches for “Bitcoin going to zero” have reached a five-year peak, hitting a perfect 100 score on the relative interest scale. This surge in doom-scrolling interest matches levels last seen during the 2022 FTX collapse.
At the same time, the Crypto Fear and Greed Index, a metric that traders use to gauge market psychology, has remained under 10 for the past three days, marking extreme fear levels not seen for nearly two years.
Traders have accordingly positioned themselves with the overall market bias leading bearish, as evidenced by Bitcoin’s long-short ratio slipping below the 1.0 threshold, data from CoinGlass show.
ETF outflows extend into fifth week
Meanwhile, spot Bitcoin ETFs, which have been the primary engine that draws in institutional investment into the space, have also slowed down. Data from SoSoValue show that the 12 spot Bitcoin ETFs have recorded persistent outflows, extending what could become the first five-week outflow streak since last March.
These investment vehicles have lost nearly $4 billion in the period. For context, during the previous cycle, these ETFs had drawn in nearly $20 billion and significantly fueled Bitcoin’s rally towards fresh highs.
However, according to some analysts, a visit to $60k could also mark the bottom for the current cycle. This area coincides with the 200-week EMA, which has historically acted as a strong support level in past bear cycles.
Disclosure: This article does not represent investment advice. The content and materials featured on this page are for educational purposes only.