Will Polygon price retest January highs as stablecoin activity and app revenue surges?


Polygon has fallen nearly 40% from its yearly high in tandem with a market-wide weakness. Can it recover from its losses now as its stablecoin market and app revenues surge?
- Polygon price is eyeing a rebound amid strengthening fundamentals, including stablecoin activity and revenue surge.
- A potential bullish crossover is forming on the daily chart.
According to data from crypto.news, the Polygon (POL) price fell over 50% from its January high to a yearly low of $0.088 on Feb. 11. This occurred amid a broader market pullback triggered by massive liquidations across leveraged markets as Bitcoin fell below multiple key support zones due to macroeconomic and geopolitical stress.
POL has since bounced back and remained in consolidation between $0.100 and $0.115.
Potential catalysts for Polygon price
The Polygon network is showing signs of strength, which may position it for a breakout
First, its on-chain stats have grown significantly stronger over recent weeks. Data from DeFiLlama shows that the total supply of stablecoins on the network has surged to $3.26 billion from the $2.4 billion seen at the beginning of February.
At the same time, the weekly revenue generated by DeFi apps on the network has also soared by nearly 70% within the period.
A stronger stablecoin supply and weekly revenue suggest a surge in activity and liquidity, which is a healthy sign for a network and could likely attract more institutional capital.
Second, Polygon’s aggressive token burn strategy is also helping support its price gains. It has recently completed burning over 100 million POL tokens. As tokens are burnt, they are permanently removed from the circulating supply, driving scarcity and providing an accessible bullish narrative for short-term traders.
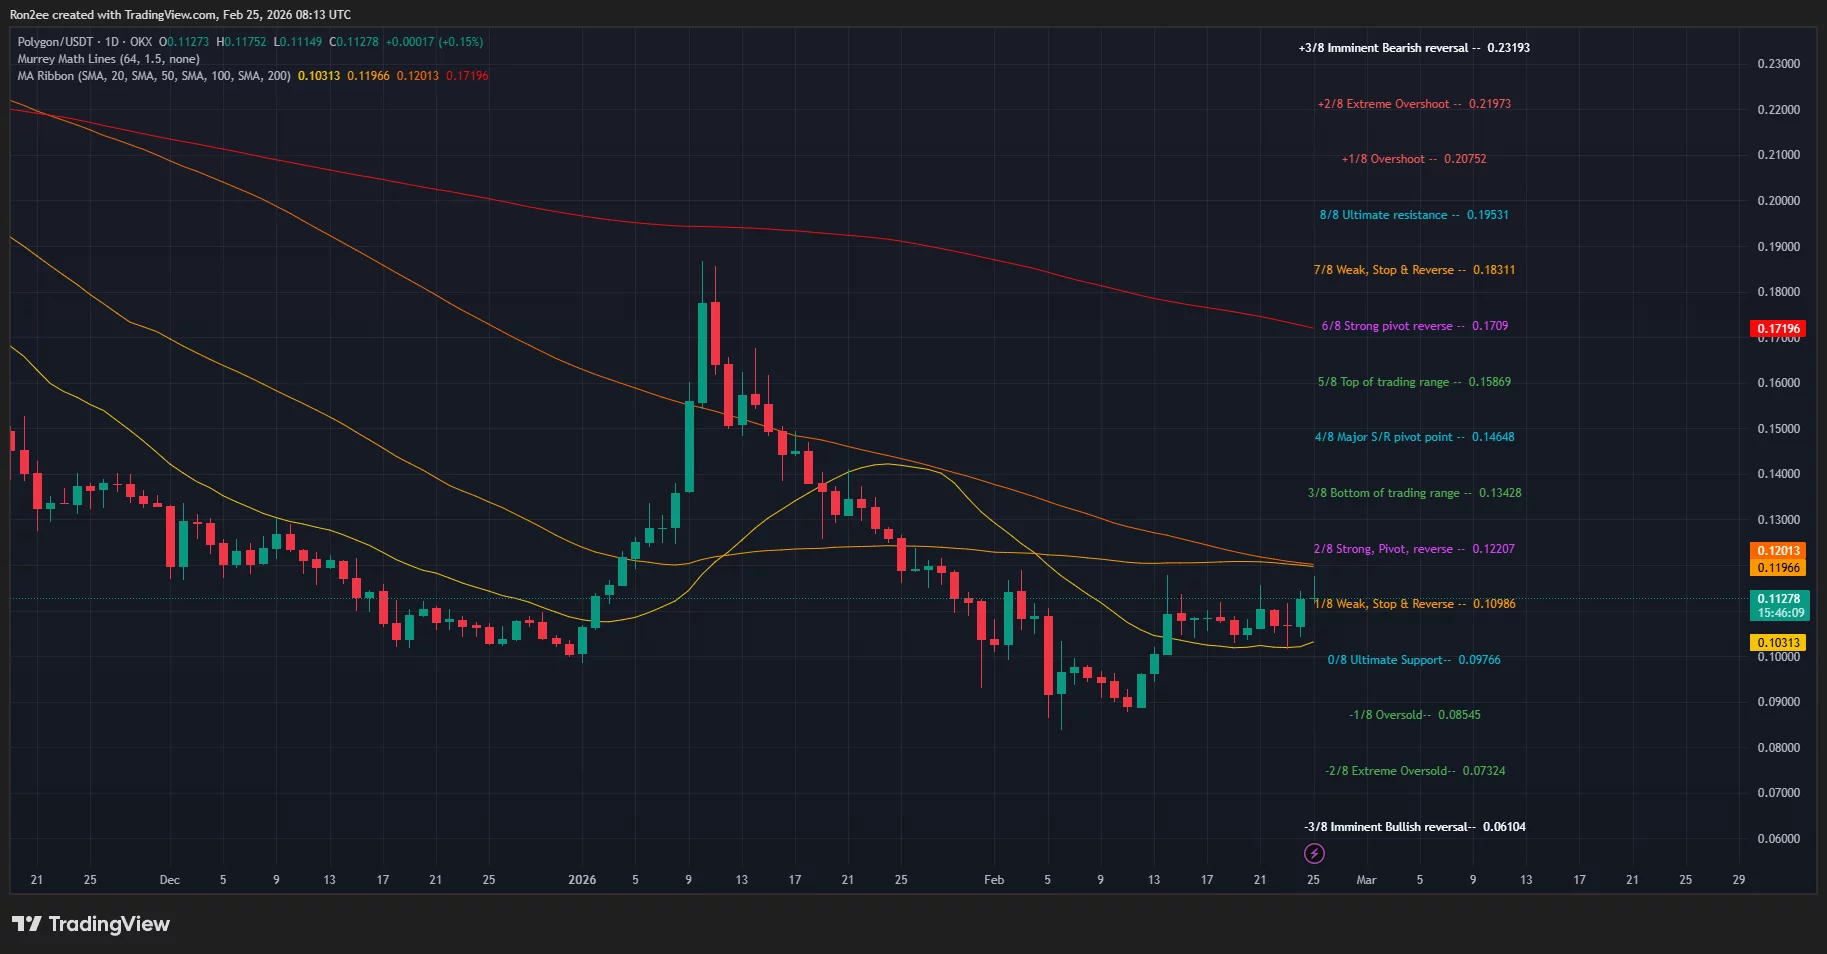
Third, the daily chart shows that the Polygon price is close to confirming a bullish crossover between the 50-day and 100-day moving averages. Bullish crossovers are typically followed by sustained rallies once confirmed.
Key levels to watch
For now, the next overhead resistance level lies at $0.122, which is the strong pivot reverse level of the Murrey Math lines. Bulls must reclaim this level to confirm a trend reversal.
Subsequently, bulls can then try to push the token all the way up to its January high at $0.184, which would mark a roughly 64% rally from its current price of $0.112.
On the contrary, failure to hold the ultimate support level of the Murrey Math lines at $0.097 will result in a drop back to its yearly low of $0.088.
Disclosure: This article does not represent investment advice. The content and materials featured on this page are for educational purposes only.