World Liberty Financial price breaks out of bullish triangle pattern amid $10m WLFI buyback


World Liberty Financial price bounced sharply after breaking out of a month-long triangle amid a surge of on-chain buyback activity.
- WLFI traded is up 8% following a clean breakout from a month-long triangle.
- On-chain data shows roughly $10 million in USD1 spent on buybacks, lifting price toward the top of its weekly range.
- Rising volume, open interest, and improving momentum indicators paint a more bullish short-term outlook.
World Liberty Financial’s token traded at $0.171 at press time, up 8% in the last 24 hours. The move placed WLFI near the upper end of its weekly range between $0.117 and $0.170, putting the token 20% higher on the week and 15% higher in the past month.
WLFI’s (WLFI) trading volume rose to $320 million over the past day, up 26%, showing more traders stepping back in after a quiet stretch. With futures volume up 24% to $582 million and open interest up 14%, derivatives activity also picked up.
Rising OI during an upward trend often indicates the entry of new long positions into the market as opposed to short covering, which strengthens the price action.
Buyback activity fuels price recovery
The bounce comes as WLFI’s team appears to have restarted its on-chain buyback program. Data from Arkham shows roughly $10 million in USD1 was used to buy 59 million WLFI tokens over the past six hours.
Most of this happened in one concentrated window, where 7.79 million USD1 purchased 46.5 million tokens at an average price near $0.167.
The renewed demand comes at a time when WLFI has been under pressure. The token has fallen from its $0.26 September peak to lows near $0.15, cutting an estimated $1 billion from the Trump family’s crypto-linked holdings.
The ecosystem has also faced partnership setbacks, including heavy losses at ALT5 Sigma, which bought $750 million in WLFI a few months back.
Still, the project continues to expand integrations such as Dolomite’s USD1 rewards program and regular token burns, which have helped stabilize sentiment.
World Liberty Financial price technical analysis
The chart shows a clear symmetrical triangle that formed through October and early November as WLFI made lower highs while also printing higher lows. This kind of pattern typically builds pressure before a strong move, and WLFI broke out right at the apex with a string of firm green candles and rising volume.
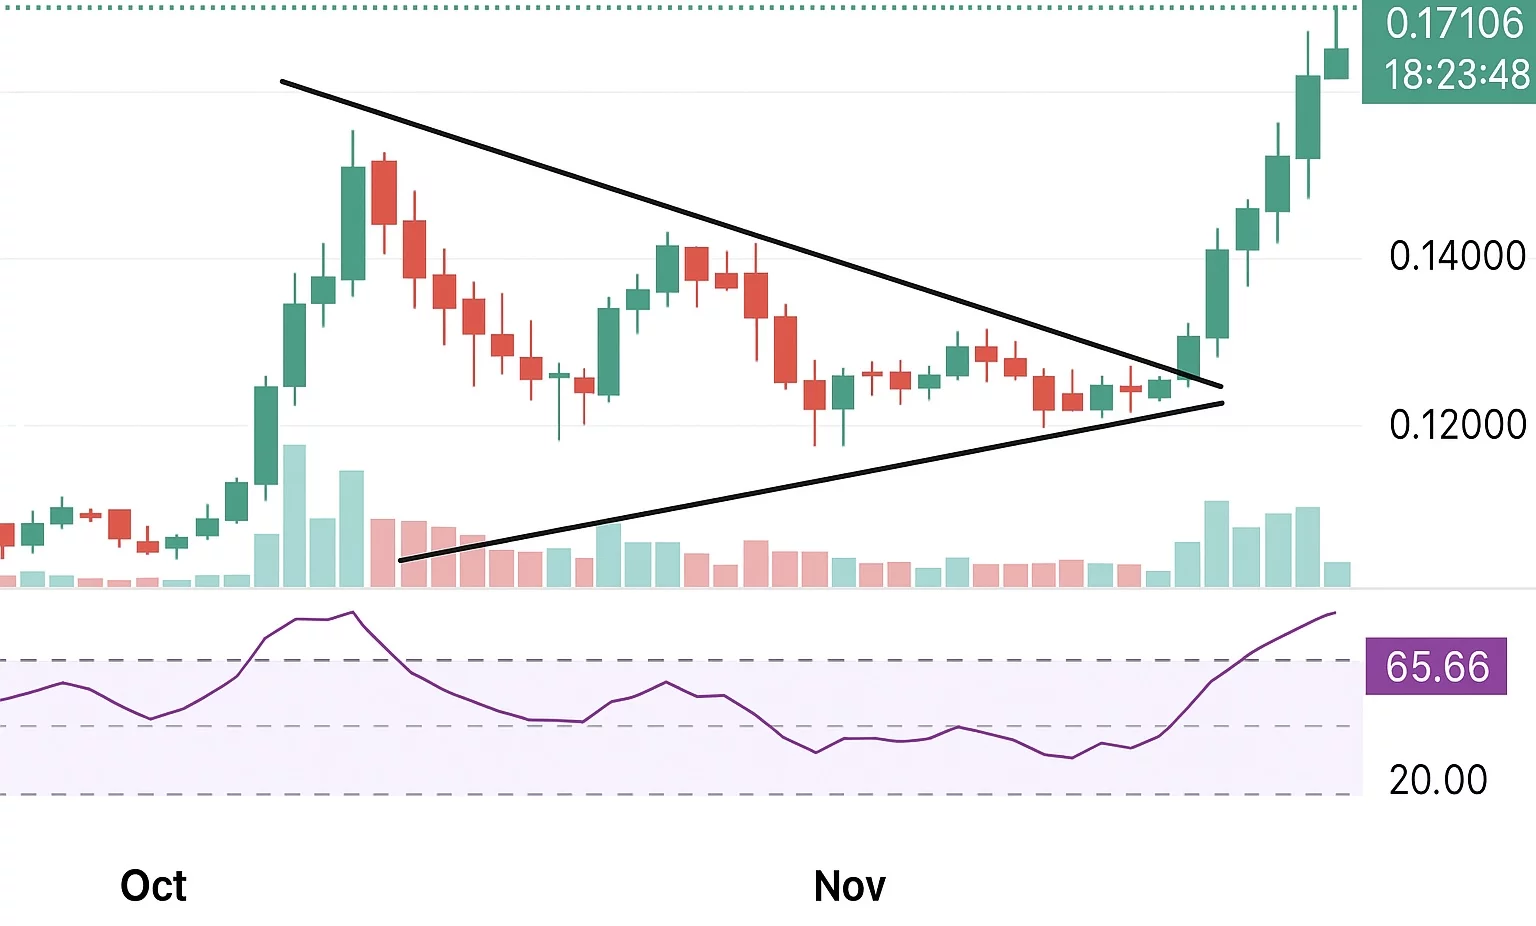
Price then extended quickly into the $0.17 zone. Momentum indicators support the breakout. The relative strength index rose towards 63 after making higher lows during the consolidation, suggesting that buying pressure was already building before it became obvious.
The only early warning indicators are the Stochastic RSI sitting at extreme levels and the Williams indicator slipping into overbought territory, which occasionally precedes a pause.
If WLFI holds above the $0.16 breakout zone, the move could stretch toward $0.19–$0.20 as long as buybacks continue and volume stays firm. A drop back inside the triangle would weaken the setup and expose the $0.14 area, which acted as support through late October.