XLM Price up 1.17% from key support: bullish structure points to $0.35 rally


Stellar is showing signs of strength after reclaiming a historic support level. With bullish structure forming and key confluences in place, a breakout toward $0.35 could be underway.
Stellar (XLM) is trading at a critical technical level that has historically acted as a major barrier. Recently flipped into support, this zone could now serve as the foundation for a fresh bullish rally.
The current market structure shows clear higher highs and higher lows, and with price action bouncing 1.17% off this zone, XLM appears poised for further upside. This technical setup aligns with strong support from both the volume profile and moving averages, increasing the probability of a bullish continuation.
Key technical points
- Key Support Reclaimed: The $0.20 level, resistance since April 2022, has been flipped into support.
- Bullish Market Structure: Price is forming a rising channel with higher highs and higher lows.
- Confluence of Support: XLM is bouncing off a zone supported by the 200-day MA, point of control (POC), and channel trendline.
- Volume Behavior: Declining volume at support often precedes an influx, which could propel price upward.
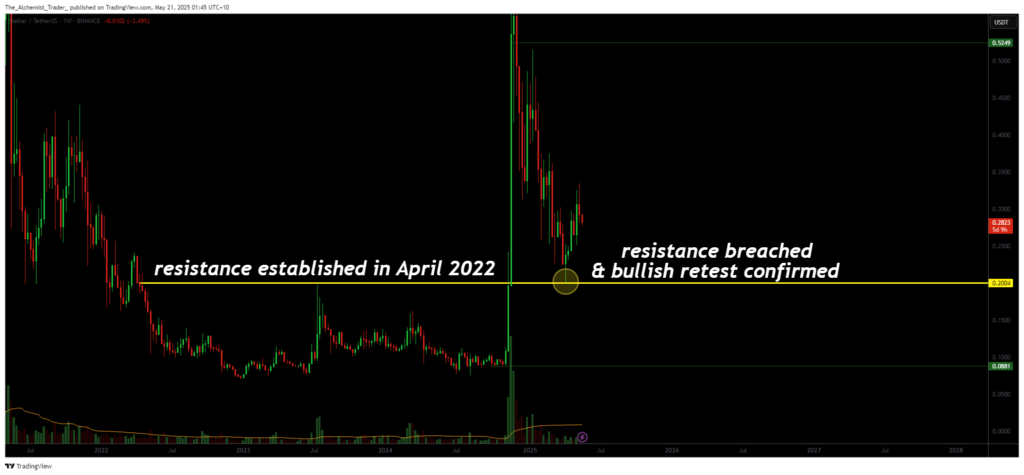
XLM’s technical structure is favoring the bulls following a confirmed bullish retest of the $0.20 level, a resistance that had suppressed price since Q2 of 2022. This high-timeframe breakout is significant. Not only has the level held as support throughout 2025, but it also aligns with a broader market shift in sentiment.
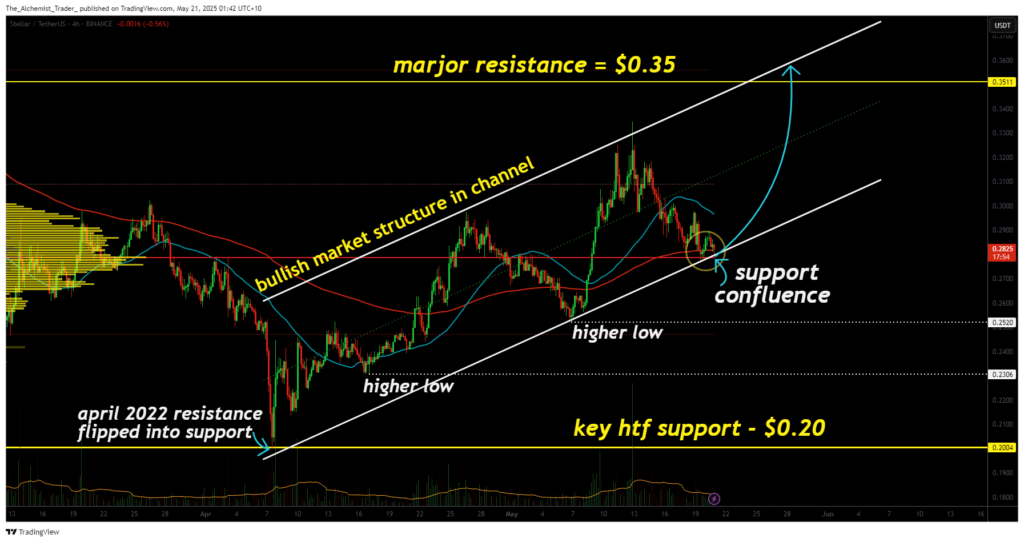
From a structural standpoint, the asset is making a series of higher lows and higher highs, confirming an uptrend. On the intraday charts, price is trading within a bullish ascending channel, currently testing the lower boundary, a level supported by the 200-day moving average and the POC. These technical markers strengthen the credibility of this zone as a strong demand area.
A bounce from here is already underway, with a 1.17% uptick, but this could just be the beginning. Volume has declined at the support zone, a behavior often observed before a strong directional move. If the next influx is dominated by buyers, XLM could accelerate toward the next major resistance at $0.35, a level that hasn’t been tested since late 2023.
What to expect in the coming price Action
If support at $0.20 continues to hold and is followed by a volume-backed move, XLM could rally toward the $0.35 region in the short term. With bullish structure in place and key levels aligned, the outlook remains positive unless key supports break down.