XRP price at risk of a crash as two risky chart patterns form


XRP’s price is on track to drop for two consecutive weeks, as it pared back gains made earlier this year.
- XRP price has formed a large double-top pattern on the weekly timeframe chart.
- It has formed a dragonfly doji candle on the weekly timeframe chart.
- XRP inflows and futures open interest have pulled back recently.
Ripple (XRP) token was trading at $2.05, down by ~15% from its highest point this year, and technical analysis points to more downside in the near term.
The decline happened as market participants continued to react to the happenings in Washington, where the Senate Banking Committee withdrew the Market Structure Bill after objections by Coinbase, the biggest cryptocurrency exchange in the United States.
Ripple Labs has expressed support for the bill, with Brad Garlinghouse, the Chief Executive Officer, saying that having a bill was better than having none. He believes that the bill has more good things for the crypto industry.
XRP dropped as the momentum in the exchange-traded fund market waned. Data compiled by SoSoValue shows that spot XRP ETFs have had $107 million inflow this month, lower than December’s $500 million and November’s $666 million.
Another sign that demand is falling, with the futures open interest being in a downward trend since January 6. It has moved from a high of $4.5 billion to $3.9 billion today.
XRP price analysis points to a bearish breakout
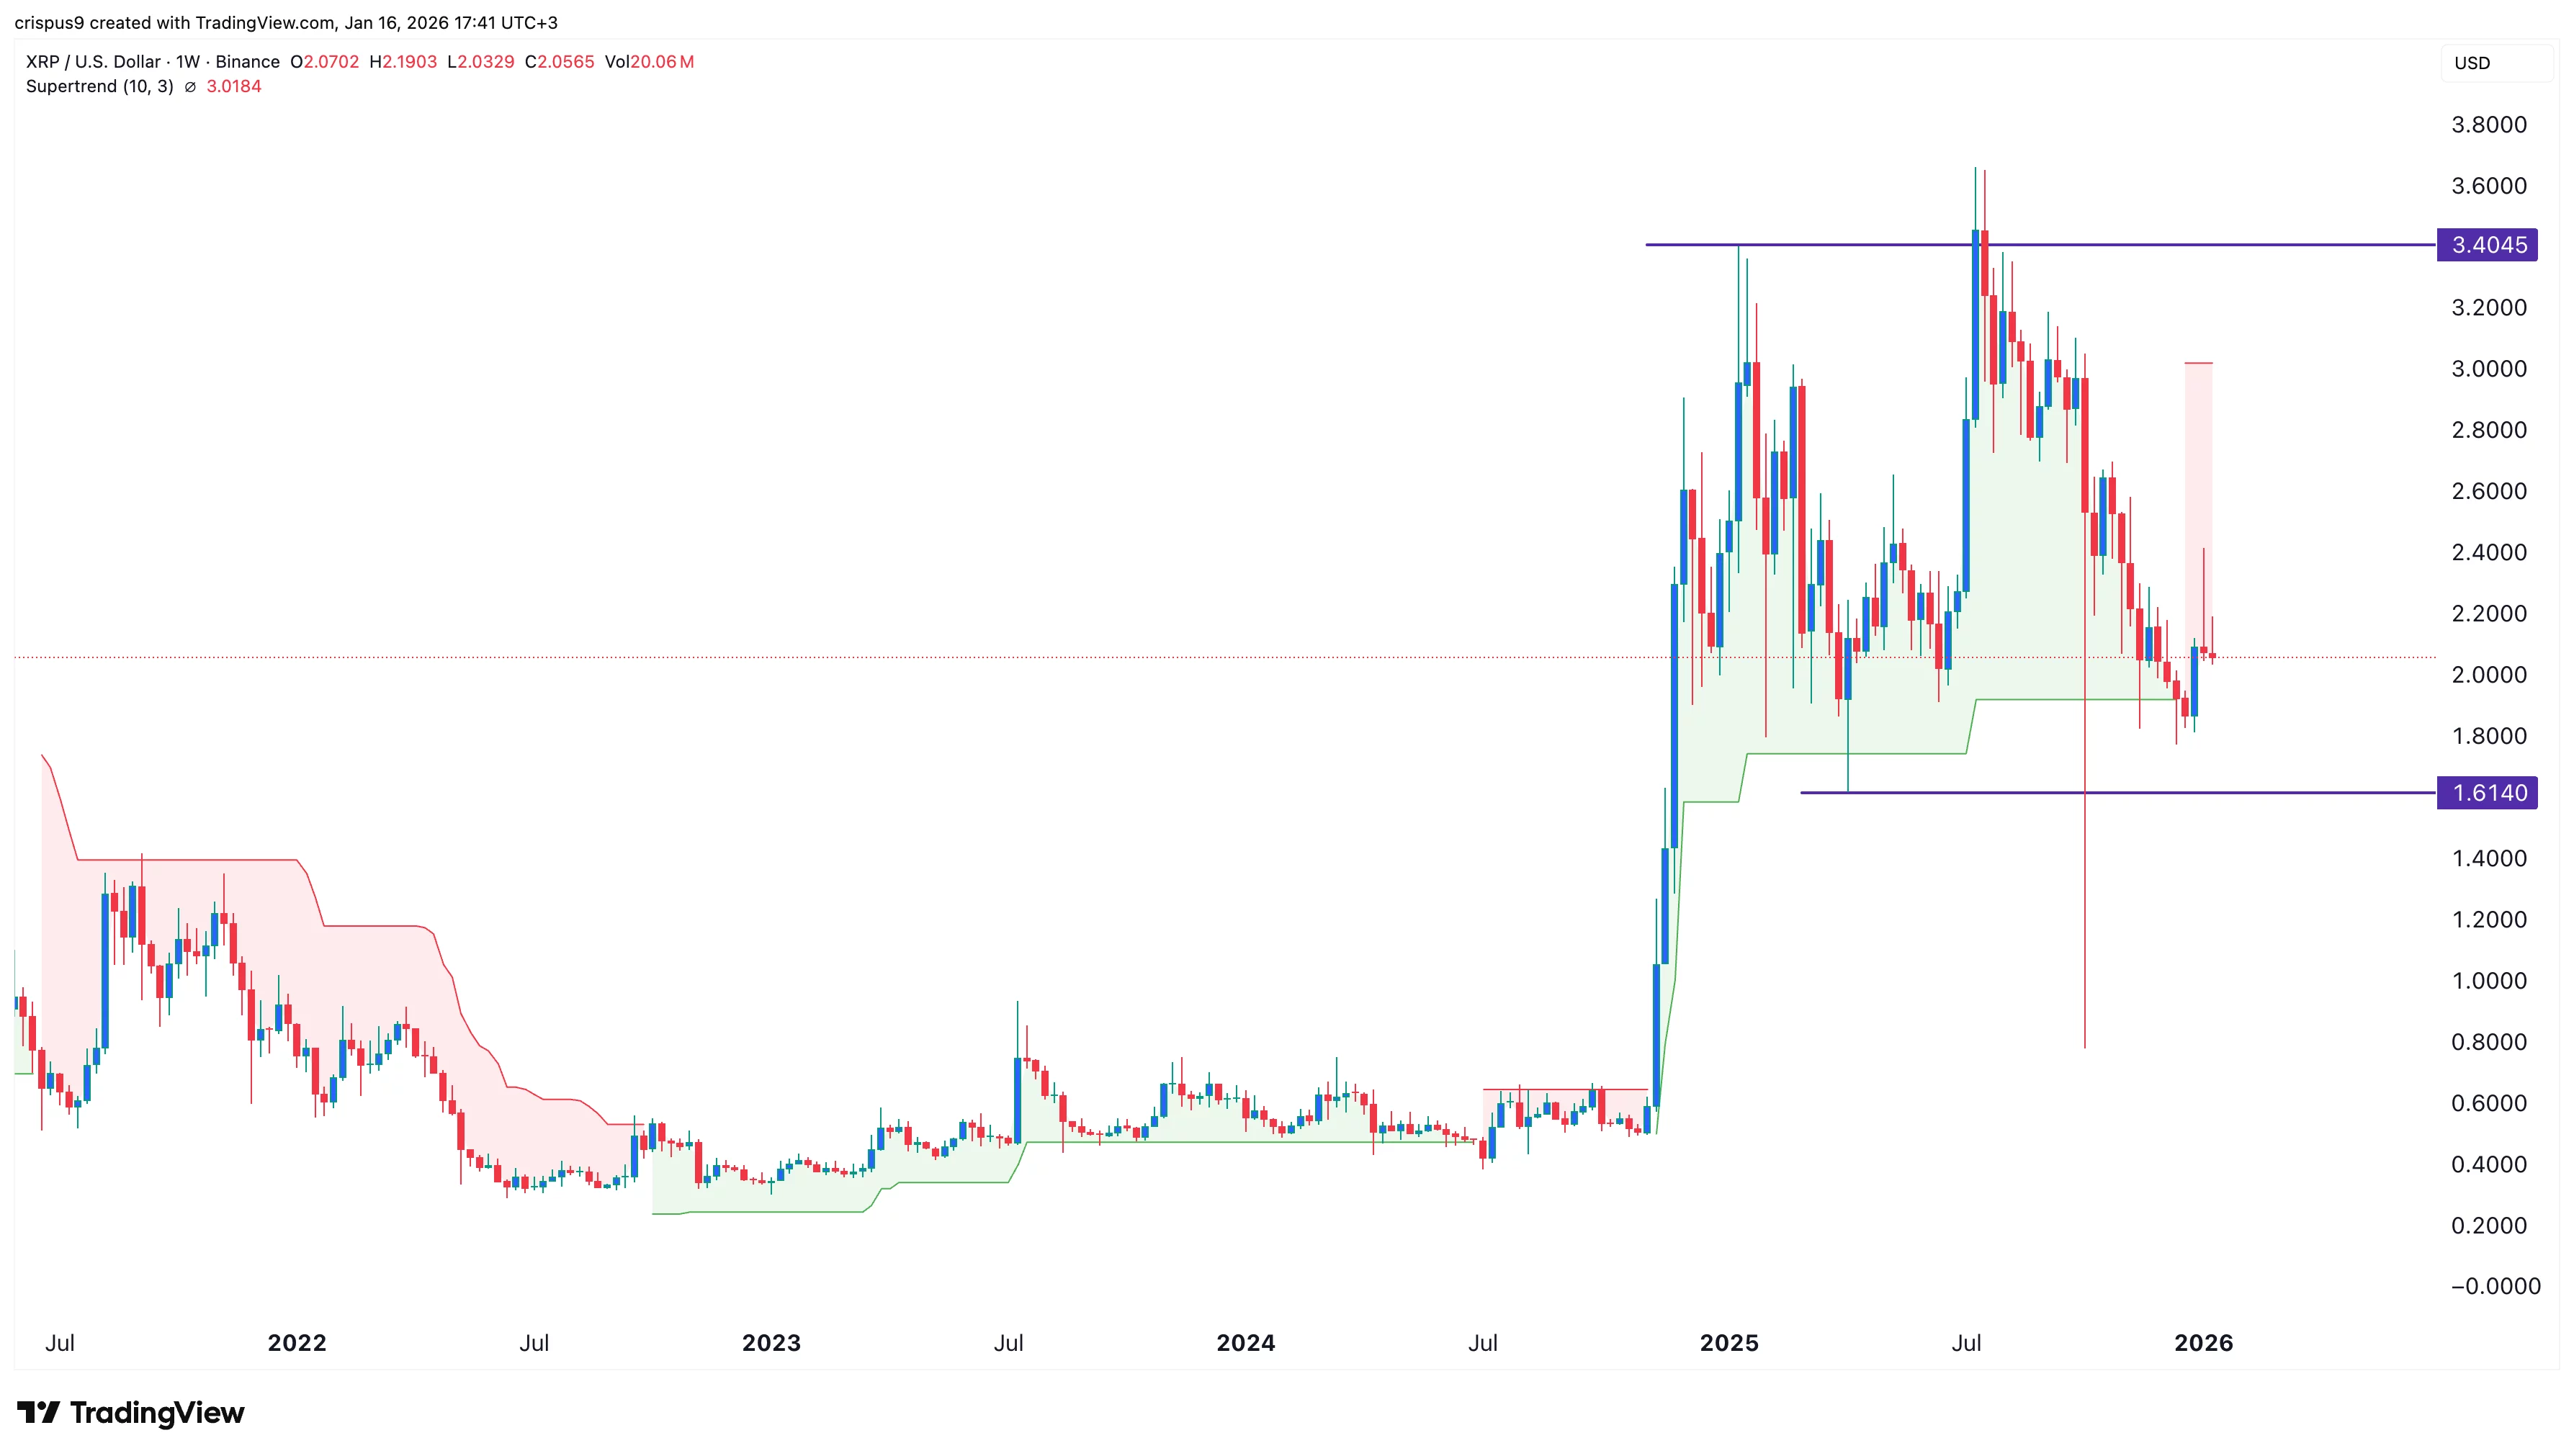
The weekly chart shows that XRP has slumped from a record high of $3.6550 in July to the current $2.05. A closer look shows that it has formed a few bearish patterns. It formed a dragonfly doji candlestick pattern last week.
This pattern consists of a tiny body and a long upper shadow and is a common bearish reversal sign. It has also formed a double-top pattern at $3.4045 and a neckline at $1.6140, its lowest swing in April this year.
The token has moved below the 50-week and 100-week Exponential Moving Averages, a sign that bears are in control. It has also moved below the Supertrend indicator.
Therefore, the most likely scenario is where the token retreats further in the coming weeks. If this happens, the initial target to watch will be the December low of $1.7712. A drop below that price will point to more downside to the neckline at $1.6140, which is about 22% below the current level.