XRP price forms bearish head and shoulders pattern: impending collapse towards $0.61?


XRP is currently on the brink of a major technical shift, with a bearish head and shoulders pattern forming on the charts. If key support levels fail, this could trigger an impulsive move toward significantly lower prices, with $0.61 in sight.
Ripple’s (XRP) price action is currently confirming a bearish head and shoulders pattern, a technical formation that signals downside. This pattern is on the verge of being fully activated, and traders should be aware of its implications for upcoming price movement.
The activation of the pattern hinges on the current swing low being broken, which would trigger a technical target that could lead to a sharp move lower. Understanding the key levels and how this pattern behaves is crucial for making informed trading decisions.
Key points:
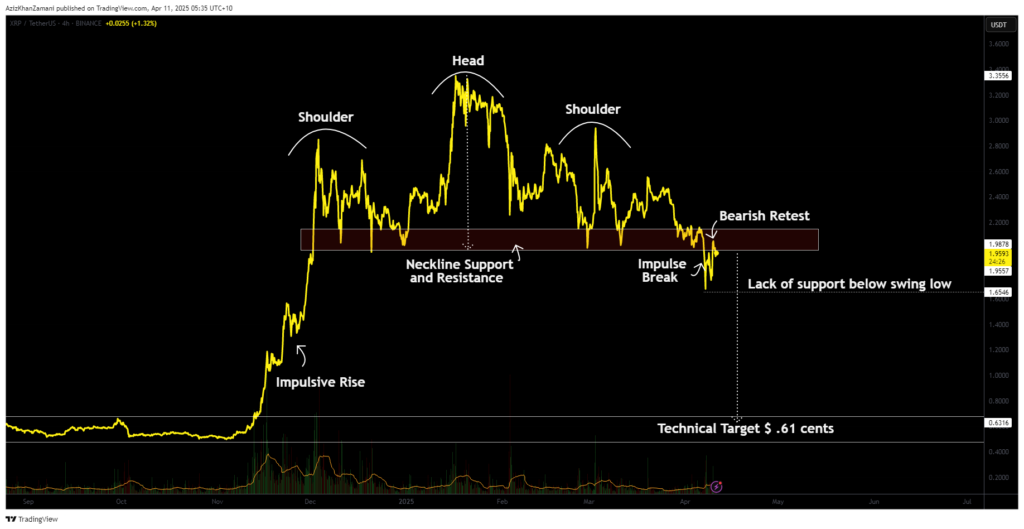
- XRP is forming a bearish head and shoulders pattern, with a well-defined neckline support range between $1.97 and $2.13
- The breakdown below the neckline is about to activate the pattern, targeting $0.61, a level with minimal support below
- The activation of the pattern is contingent on breaking the current key swing low, which will confirm the bearish move
Neckline support is broken
XRP’s price action followed a clear and impulsive rise since November 2024, reaching a high of around $3.37. After this rise, price action slowed down, entering a consolidation phase. During this phase, the left shoulder of the head and shoulders pattern formed, followed by the head at the all-time highs, and then the right shoulder, which has confirmed a lower high. This completed the pattern’s setup, and now the neckline—ranging from $1.97 to $2.13—has become the key support zone.
Recently, XRP broke below the neckline support, marking a significant shift in market sentiment. This is the first time since early December that the price has fallen below this critical range. This breakdown is vital because it confirms a continuation of the bearish trend, establishing a new lower low in the market.
Price action is currently attempting to retest the neckline, but this retest remains bearish. If the price fails to reclaim the neckline and breaks the key swing low, it will fully activate the bearish head and shoulders pattern and open the door for a sharp move lower.
The activation of the pattern could lead to an impulsive decline toward the $0.61 target, a level where there is very little support beneath the current price. The absence of support below this zone means that price could fall rapidly, similar to the bullish move that occurred when the pattern initially formed.
Once the bearish head and shoulders pattern is confirmed, it becomes a technical target for traders to watch closely. The pattern’s impulsive nature means that once the key low is taken out, the market could accelerate toward the downside swiftly.
How to trade this setup
For traders, this setup presents a clear opportunity for a short position once the pattern is fully activated. The key confirmation comes when the current swing low is taken out, signaling the full activation of the bearish head and shoulders pattern. From there, the price could move quickly toward the $0.61 target due to the lack of support in the area.
If the pattern plays out as expected, the reward could be substantial. However, like all technical patterns, the key is patience. Only once the pattern is confirmed can traders confidently position themselves for the potential downside, making it crucial to avoid premature entries and wait for confirmation.