XRP price forms multiple bullish patterns as Ripple ETF inflows jump


XRP price has formed a falling wedge, a double-bottom, a bullish pennant, and a cup-and-handle pattern, pointing to more upside as inflows in existing ETFs gain momentum.
- XRP price could be on the cusp of a strong bullish breakout this month.
- It has formed numerous bullish chart patterns on the daily timeframe.
- Top XRP ETFs are seeing strong inflows, a sign of rising demand.
Ripple (XRP) token was trading at $2.870 on Wednesday, up from the double-bottom point at $2.7167. It has jumped by nearly 80% from the lowest level this year.
XXRP ETF inflows are rising
One of the potential catalysts for the XRP token is that existing futures-based ETFs are gaining momentum. The Teucrium 2X Long Daily (XXRP) has experienced inflows in the last 22 consecutive weeks. It added $18.2 million in assets last week, up from $10.3 million a week earlier. This increase has brought total assets to over $355 million, making it one of the biggest altcoin ETFs on Wall Street.
Similarly, the ProShares Ultra XRP ETF (ticker: UXRP) has added assets in the last four consecutive weeks. It added $5.4 million and now has $100 million in assets.
Their strong growth despite high fees and risks shows that there is strong demand for XRP ETFs as the deadlines for some ETFs near. Polymarket data show that the odds of a Ripple ETF approval before year-end have jumped to over 80%, a move that will lead to more demand.
Meanwhile, Ripple Labs continues to implement deals that will boost its ecosystem growth over time. It recently inked a deal with Thunes, a top fintech company that offers cross-border payment solutions globally. The deal will facilitate easier and faster transactions.
It also recently partnered with Aave, enabling the Ripple USD stablecoin to be part of the Horizon project. Data show that the RLUSD supply on Horizon has jumped to $28 million, a substantial amount considering that the total market size stood at $60 million. RLUSD’s market capitalization has already jumped to over $700 million and may hit $1 billion this year.
XRP price technical analysis
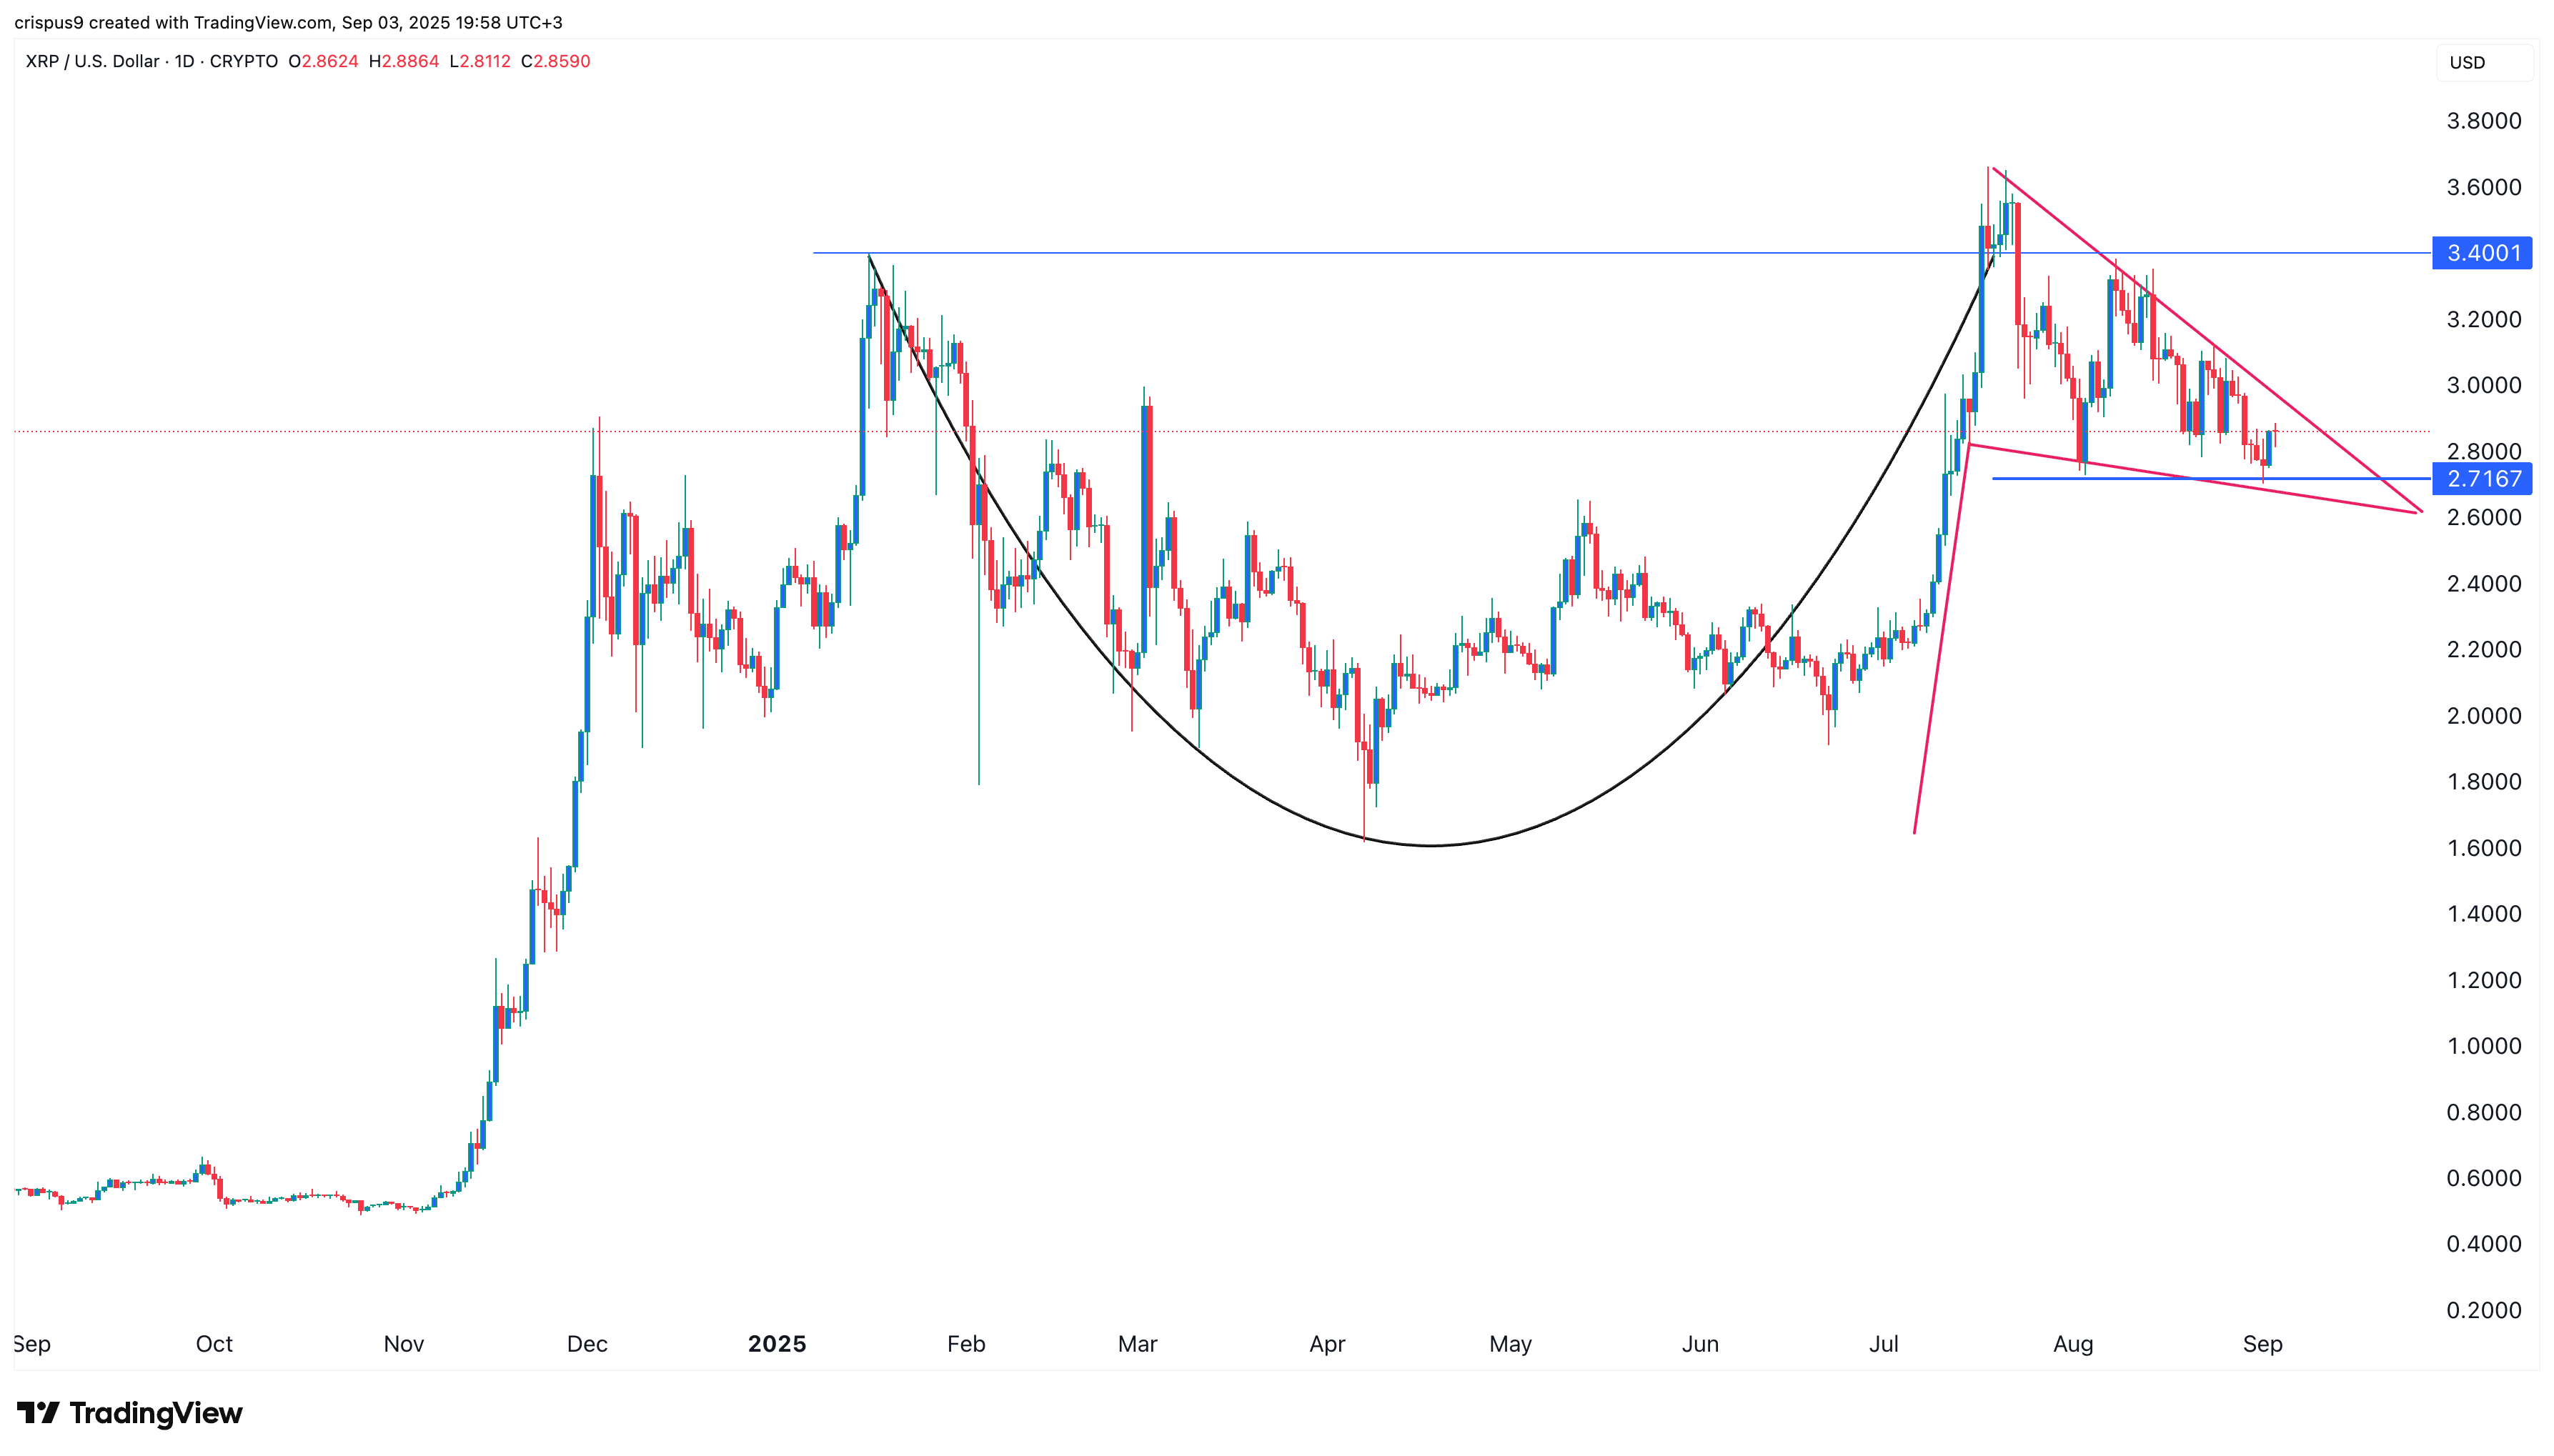
The daily time frame chart shows that the XRP price has formed several unique chart patterns that may push it higher in the coming weeks. It has formed a double-bottom pattern at $2.7167, with its neckline at $3.3700, the Aug. 8 swing high.
The coin has also formed a falling wedge pattern, which comprises two descending and converging trendlines. This wedge is also part of the handle section of the cup-and-handle pattern.
It is also part of the bullish pennant pattern, which is made up of a vertical line and a triangle. Therefore, these patterns, together with the upcoming ETF approvals, mean that the XRP price will likely have a strong bullish breakout this month. In this case, it may jump to the upper side of the cup at $3.60.