XRP sees increased downward pressure as 80-week inflow streak ends


XRP is under pressure after breaking a key inflow streak that had lasted for 80 consecutive weeks.
The token is trading at $2.28 at press time, down 2.6% in the past 24 hours, and has remained within a narrow seven-day range of $2.29 to $2.40. According to a report from CoinShares published on May 26, XRP (XRP) investment products saw a record outflow of $37.2 million last week, officially ending the long-running streak of weekly inflows.
Month-to-date outflows total $28.6 million, though year-to-date numbers remain positive at $226 million, with $1.36 billion still held in XRP-based products under management. This shift coincides with an apparent increase in institutional interest in other digital assets.
Bitcoin (BTC) led last week’s inflows with $2.9 billion, followed by $326 million for Ethereum (ETH). Meanwhile, Cardano (ADA), Sui (SUI), Solana (SOL), and Litecoin (LTC) all recorded significant inflows, highlighting a rotation in investor sentiment. SUI, for example, attracted $2.9 million last week and has $23.9 million in YTD inflows.
The broader digital asset market recorded $3.3 billion in inflows last week, bringing the six-week total to $10.5 billion and pushing year-to-date inflows to a record $10.8 billion. CoinShares attributes this increase in demand to rising treasury yields and concerns about the U.S. economy after Moody’s downgrade.
Alongside the shift to outflows, derivatives metrics for XRP show declining interest. In the pasf day, open interest declined slightly by 0.8% while derivatives volume fell 8.48% to $2.87 billion, according to Coinglass data. A decline in derivatives volume typically indicates less speculative activity, while stable open interest indicates that traders are holding onto their existing positions without taking on a sizable amount of new risk.
From a technical perspective, XRP appears to be in a consolidation phase with signs of bearish momentum. The relative strength index stands at 46.6, now in neutral territory. Several moving averages signal a downtrend. The 10-day and 20-day EMAs are both below the current price and show a “sell” signal, alongside the MACD and momentum indicators.
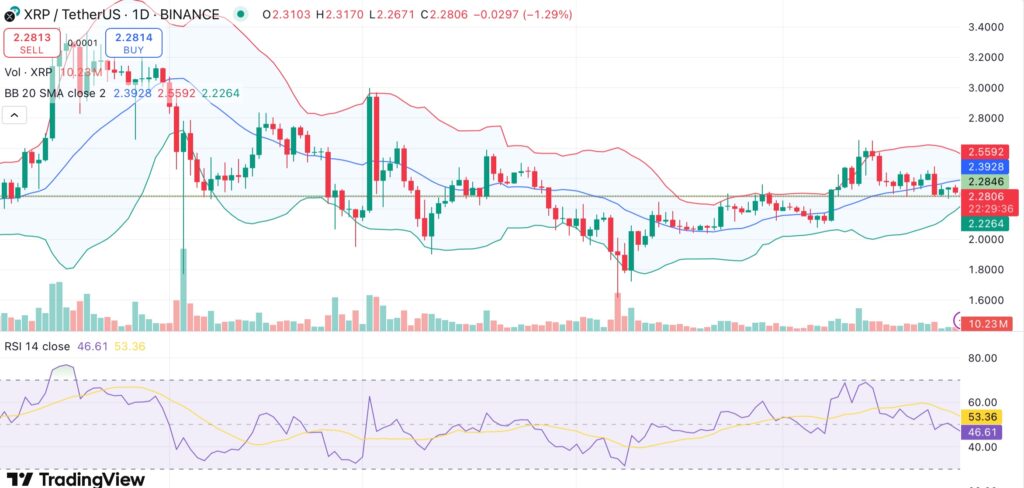
The Bollinger Bands show price hugging the lower band, indicating increased volatility and the potential for a breakout, though the direction remains uncertain. Further declines toward the 200-day simple moving average at $2.26 may be possible if XRP is unable to maintain above the 100-day SMA, which is around $2.28.
Although there is still long-term institutional interest in XRP, its short-term trend warns of caution. A break below current support levels could accelerate losses, especially if capital rotation into other altcoins continues.