Zcash spikes 80% in a month, can the bulls sustain the uptrend?


Zcash has recorded an impressive price run over the past month amid a rebound, but mixed signals from the daily and weekly charts question the asset’s next price direction.
Zcash (ZEC) surged 80% in the past 30 days, making it one of the largest gainers in this timeframe. The significant rally comes after a recovery from the low of $15.78 on July 5.
This recovery came on the back of a broader market rebound. As ZEC gains momentum, traders question whether this uptrend can be maintained or if it has reached its peak as technical indicators send mixed signals.
Zcash eyes double-bottom
On the weekly chart, ZEC is on the brink of forming a double-bottom pattern. This pattern is typically a bullish signal, indicating that a further price surge might be on the horizon if confirmed.
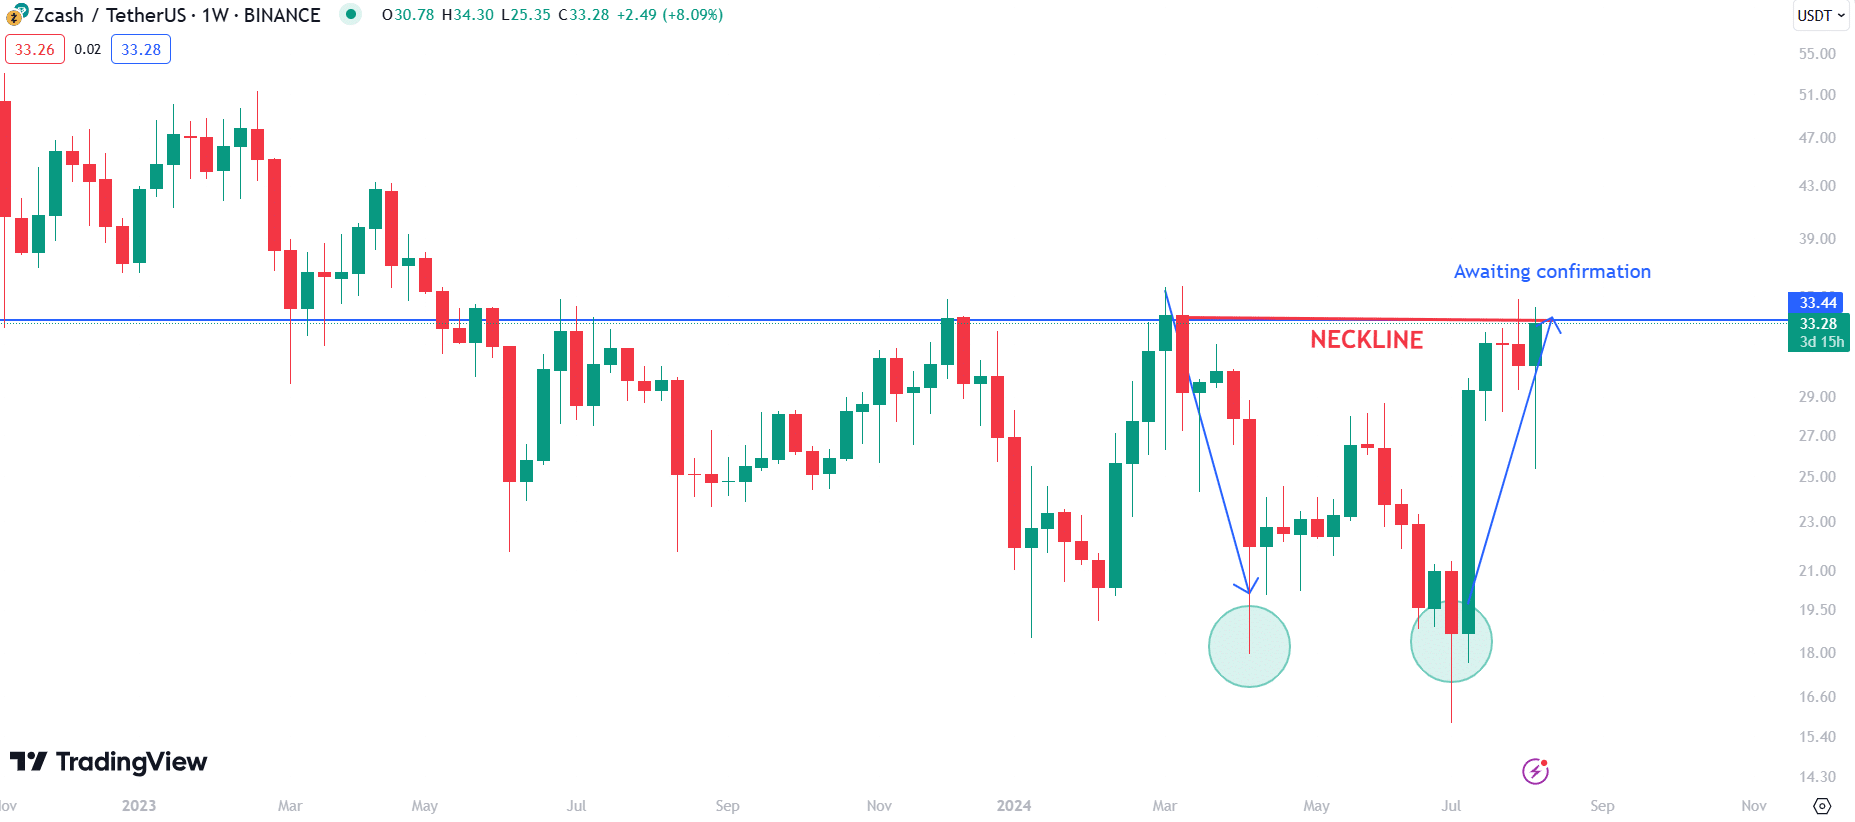
The first bottom occurred in April 2024, when ZEC dropped to a low of $17.94. Meanwhile, the second bottom formed on July 5 amid the crash to $15.78. This double bottom formation would be confirmed if ZEC closes above the neckline at $33.5.
Such a breakout could propel Zcash toward the next significant resistance levels, between $38 and $45. However, the confirmation is still pending, making this a crucial area to watch.
Growing bearish divergence
Meanwhile, the daily chart displays a potential bearish divergence, which could signal an impending pullback. The Relative Strength Index has been forming lower highs since July 26, despite ZEC’s price reaching higher highs.
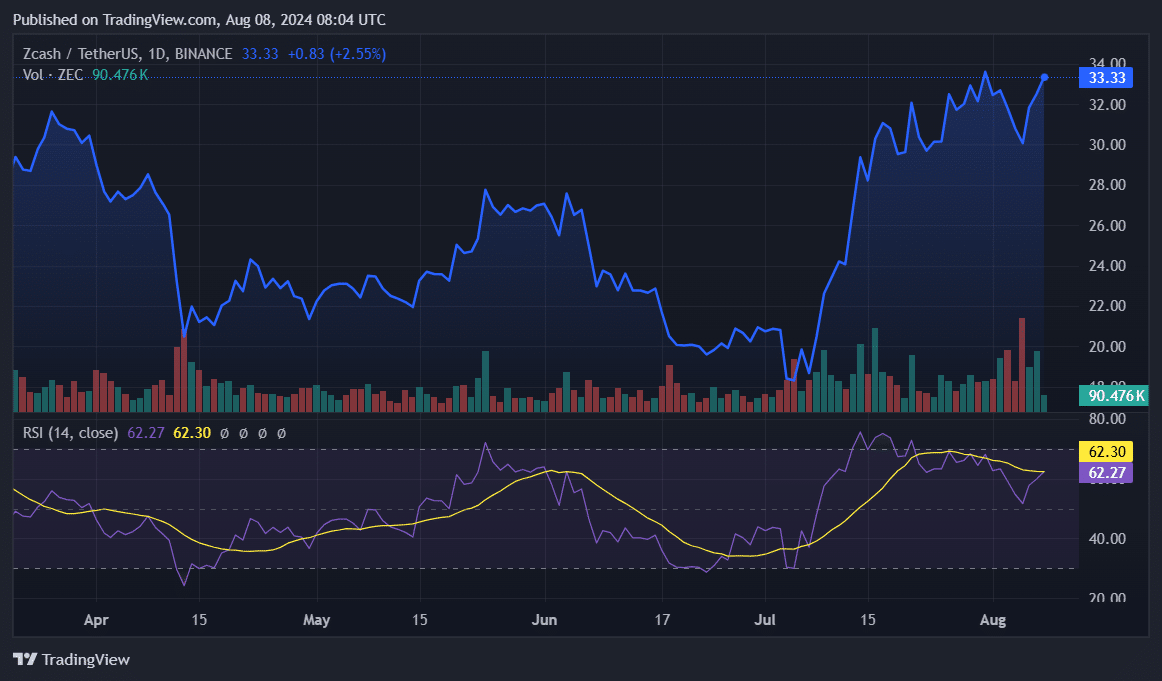
The RSI, currently at 62.30, suggests that the bullish momentum might be fading away. Divergences often precede price reversals, confirming that this pattern could indicate potential downward pressure. Despite a recent uptick, a break below the 60 level for the RSI could deepen the bearish momentum.
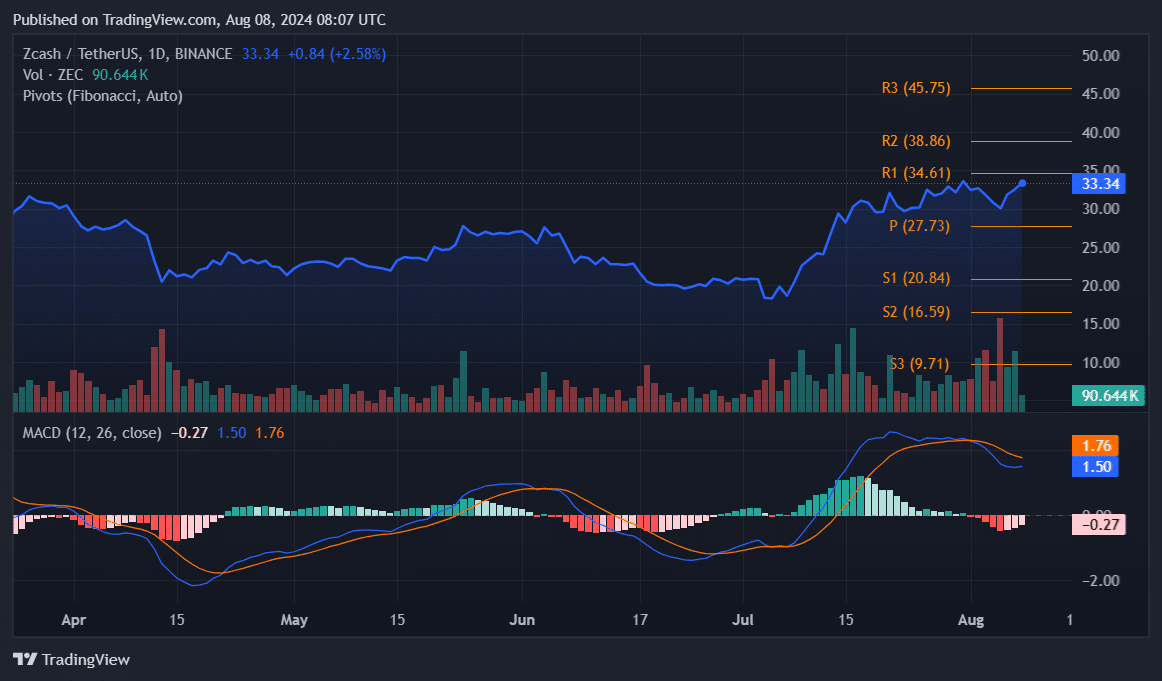
On the daily chart, ZEC’s Fibonacci Pivot Points provide data on crucial support and resistance levels. The pivot point at $27.73 acts as a critical support level. Should ZEC drop below this level, the next support levels would be at $20.84, $16.59, and $9.71.
Conversely, resistance levels are set at $34.61, $38.86, and $45.75. Currently, ZEC is trading just below the first resistance. A successful break above this level would target the second and third resistance zones, aligning with the potential continuation of the bullish trend indicated by the weekly double-bottom pattern.
ZEC MACD shows mixed signals
The daily MACD also shows a mixed signal. The MACD line is at 1.50, slightly above the signal line at 1.76, indicating bullish momentum. However, the histogram’s recent red bars suggest that the momentum might be weakening. The MACD crossing below the signal line could confirm a bearish trend reversal.
Overall, Zcash is in a critical position at this price point. The weekly double-bottom pattern shows a bullish outlook if ZEC can close above $33.44. However, the bearish divergence on the daily RSI and the mixed signals from the MACD highlight the risk of a potential pullback.
It is important to pay close attention to the key support and resistance levels provided by the Fibonacci Pivot Points. Breaking above $34.61 could reignite the bullish momentum, while a drop below $27.73 might signal a deeper correction, leading to increased FUD.