Bitcoin traders move $520m as BTC enters price discovery phase

Bitcoin’s price hit new all-time highs above $73,000 on March 12 as the pioneer cryptocurrency entered the price discovery phase.
Institutional demand for Bitcoin continues to rise despite prices trending at historic peaks. On-chain data analysis examines the major catalysts behind the latest BTC price upswing observed on March 12.
Bitcoin market supply tightens, investors move BTC to cold storage
Bitcoin’s market capitalization briefly crossed the $1.5 trillion mark in the early hours of March 12 as prices rose to a new global peak of $72,967. Bullish announcements from BlackRock and MicroStrategy, two of the largest BTC institutional holders, had set the narrative for the latest BTC price upswing this week.
Firstly, according to its recent filing with the United States Securities and Exchange Commission (SEC), BlackRock outlined plans for its Global Allocation Fund (MALOX) to incorporate spot Bitcoin ETFs into its portfolio. While this decision is still weeks or months away, it sparked hopes of more demand for Blackrock’s IBIT ETF, which already held over 204,000 BTC at press time on March 12.
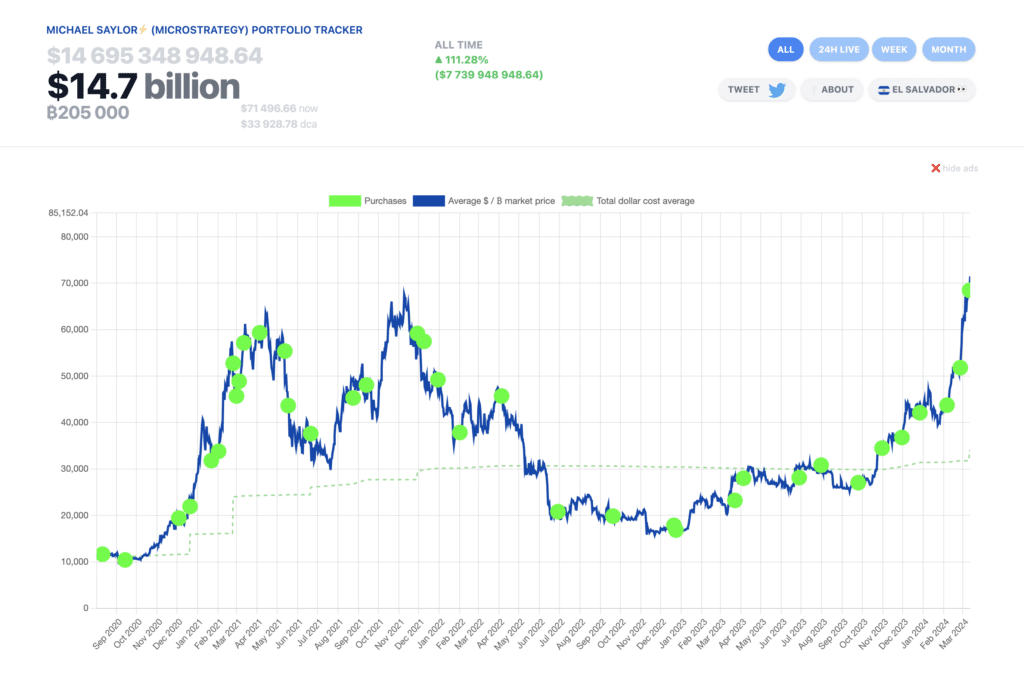
In the same vein, MicroStrategy CEO and Co-Founder Michael Saylor also announced the purchase of an additional 12,000 BTC, bringing its total stash to 205,000 BTC.

While the two key events dominated the media headlines, on-chain data revealed how traders’ positive reactions triggered the price uptick.
IntoTheBlock’s exchange netflow metric tracks the difference between deposits and withdrawal made across crypto exchanges on a given day. A negative exchange netflow often impacts prices positively in the short-term, as it means that more coins are withdrawn from the market supply.

The chart above depicts how Bitcoin holders shifted 4,470 BTC, valued at $520 million, from exchange-hosted wallets into cold storage on March 11. This implies that despite Bitcoin prices trending at record highs, investors continue to play the long game, shifting coins into cold storage rather than seeking short-term profit-taking opportunities.
Negative exchange netflows essentially reduces the number of coins readily available to be traded at the spot markets. When this coincides with a surge in market demand, it often puts upward pressure on the asset price.
Bitcoin was trading at around $72,000 as of March 12, meaning that over $520 million worth of BTC had been removed from the market supply within the last 24 hours.

Notably, Feb. 27 was the last time BTC recorded higher levels of exchange withdrawals, with a netflow of 8,050 BTC recorded. As expected, the BTC price surged 26% from $50,900 to $63,900 within 48 hours.
If this bullish pattern repeats, the 4,750 BTC outflows recorded on March 11, could clear the path for Bitcoin price to break above $75,000 in the days ahead.
Bitcoin (BTC) price prediction: Imminent breakout above $75,000?
Critical market trends suggest that Bitcoin’s price could be on the verge of another leg-up in the days ahead. In confirmation of this stance, IntoTheBlock’s global in/out of the money chart shows that with Bitcoin now in the price discovery phase, virtually 100% of the 52 million total Bitcoin holder addresses are now in a profitable position.
In essence, the majority of them could be unwilling to sell, leading to a bullish cycle of declining market supply amid rising institutional demand from MicroStrategy and BlackRock.

Without any resistance cluster above the current prices, Bitcoin bulls now have their sights set on the next milestone price target at the $75,000 territory.
But in the event of a bearish pullback, the bull could regroup and mount a formidable support buy-wall at the $68,560 zone. The chart above shows that over 6.6 million existing holders had acquired 2.9 million BTC at the maximum price of $68,560.
With bullish tailwinds from the recent market activities of key stakeholders like BlackRock and MicroStrategy, most of them could opt to hold rather than sell.
That curtailed selling pressure combined with the overwhelmingly positive media sentiment could see BTC price stage an instant rebound from $68,000.


