Bitcoin Price Analysis: Break of $8,500 Opens Up $9,500

Bitcoin has reacted positively to news coming out of the G20 meetings that there will be no regulation of cryptocurrency markets. The price of bitcoin has recovered from the lows below $8,000 to trade above $8,500 on March 20. There is a strong likelihood that the bullish move in the market is galvanized, with an attempt at $9,500 on the cards.
For those that have been following the recent postings on bitcoin, allow us to draw your attention to the chart below:
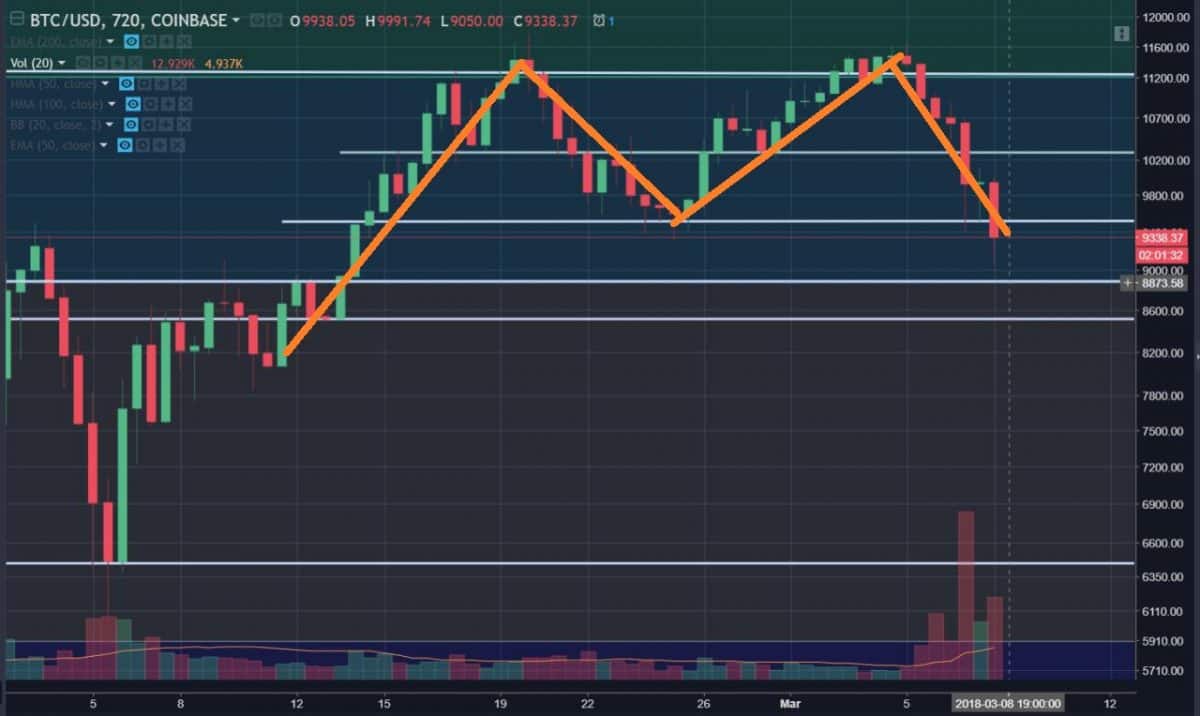
This chart was shared on March 8, 2018, revealing a double-top pattern formation that had emerged on bitcoin.
From that point onward, the price of bitcoin continued to decline rapidly until bottoming out in the $7000s.
Recently, however, in the last few days, the price of bitcoin has surged back upward to a high of $8,700. It is now trading at $8,500 at the time of writing.
What Happened?
#1 – It appears that the double-top pattern formation has completed.
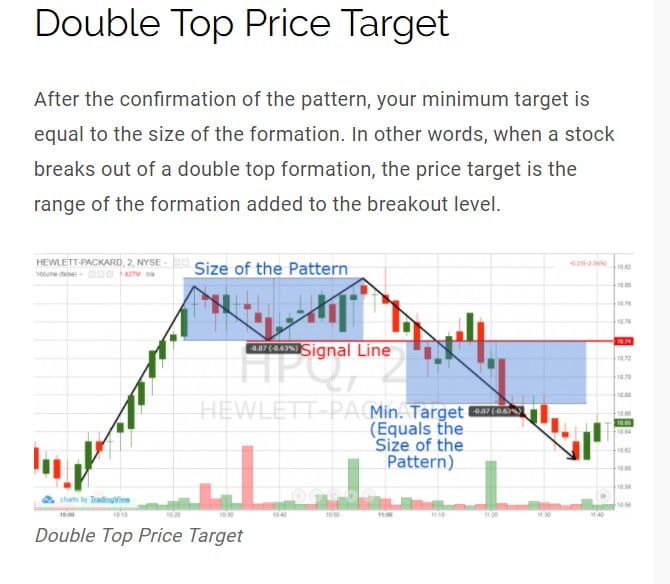
Source: https://tradingsim.com/blog/double-top/
Above is a link showing the best way to draw a price target for a double-top pattern formation. Essentially, the distance between the two tops to the ‘neckline’ of the double-top pattern formation is what one should use when calculating the decline in price from the neckline.
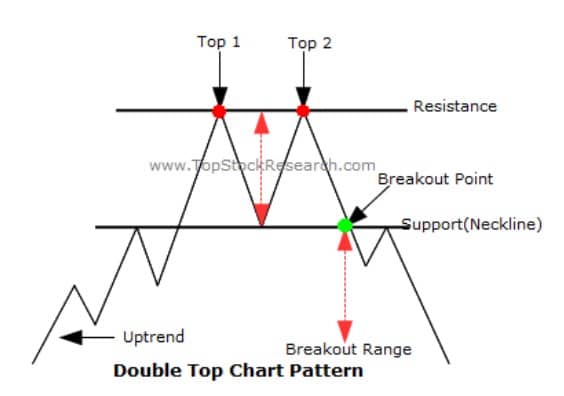
Above is another diagram of the double-top pattern formation for those that are unfamiliar with the terminology being used above.
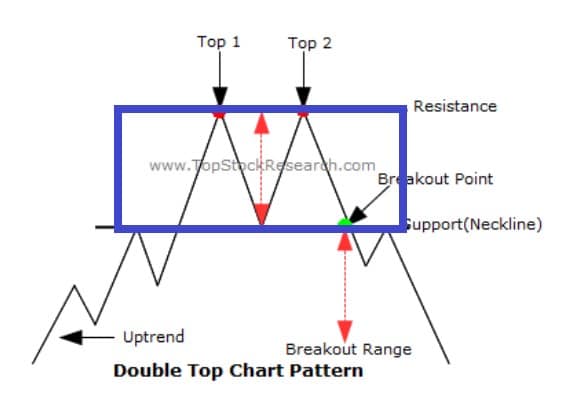
See the blue box above? The price difference between the top of that blue box and the bottom of the blue box is the amount that one should subtract from the ‘Breakout Point’ in order to get their target.
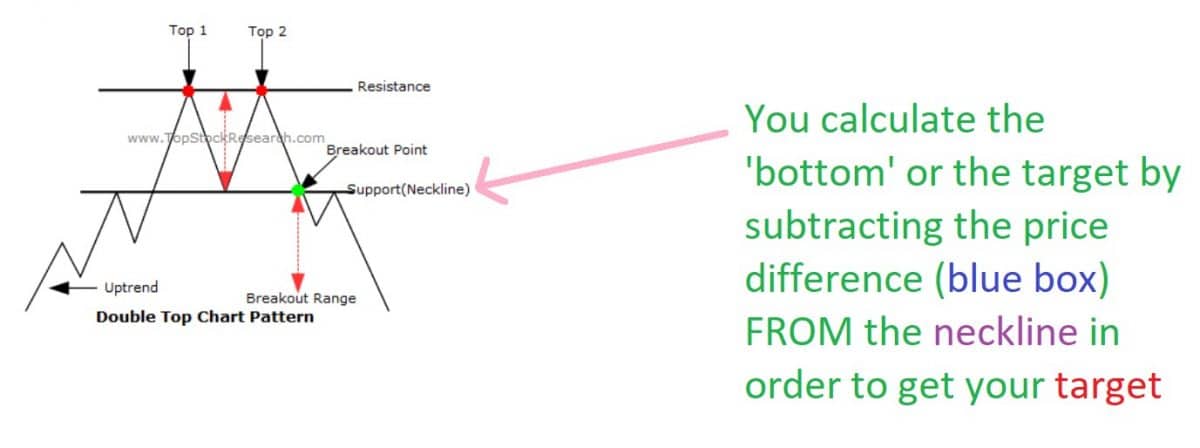
So, let’s see what this looks like on the bitcoin chart:
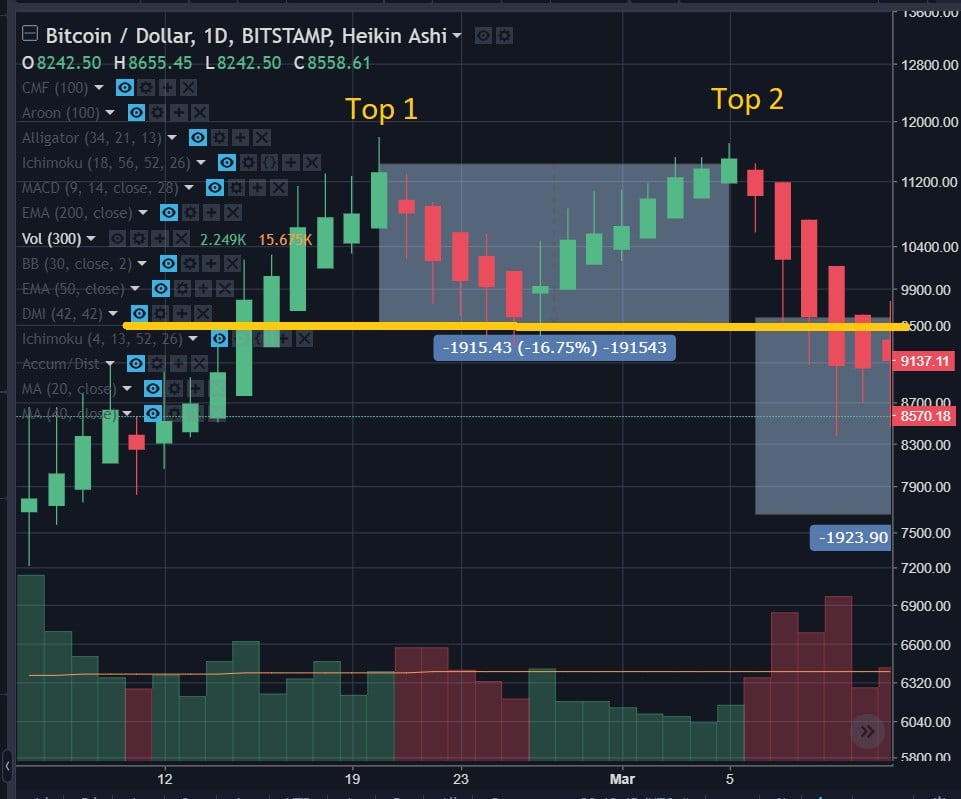
As you can see, the distance between the two tops of the formation and the neckline was about approximately $1915.43.
So, if the double-top formation target analysis holds true, the ‘bottom’ (for now) should be the neckline ($9,500) minus that distance ($1915).
That gives us roughly $7,500.
Let’s see how the price traveled:
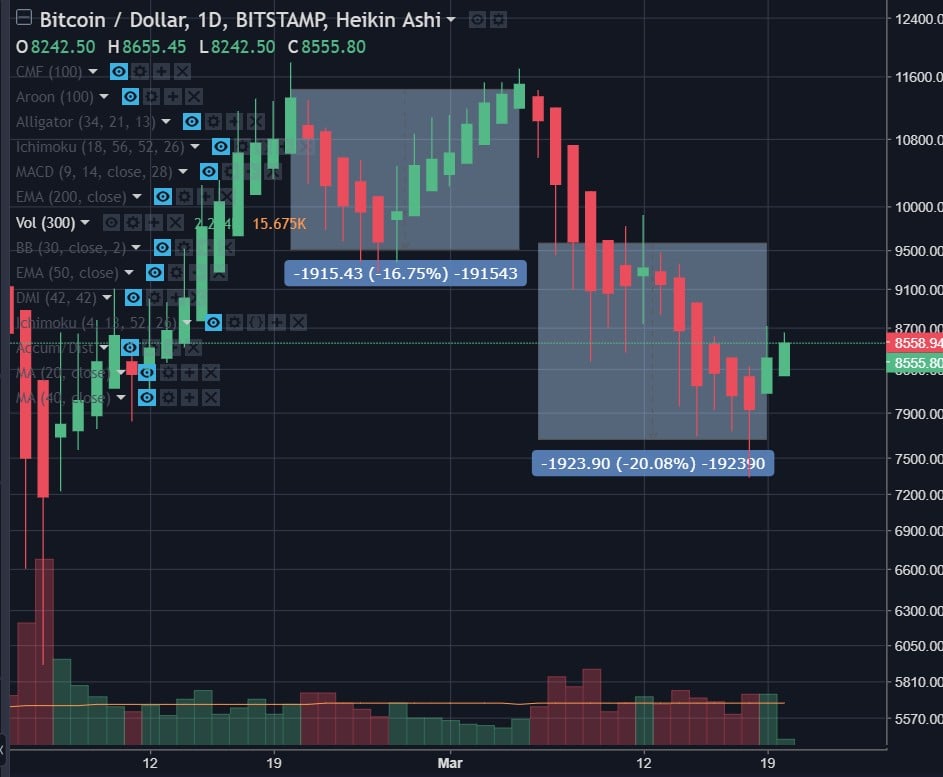
When calculating the math and seeing the price movement, they seem to match roughly (remember this price targeting is a minimum for fulfillment.
Does This Mean That the Price Has Reversed?
For now.
What Other Clues Do We Have?
The RSI.
For those that are unfamiliar, RSI tracks the momentum of price movement and can either deem something ‘oversold’ or ‘overbought.’
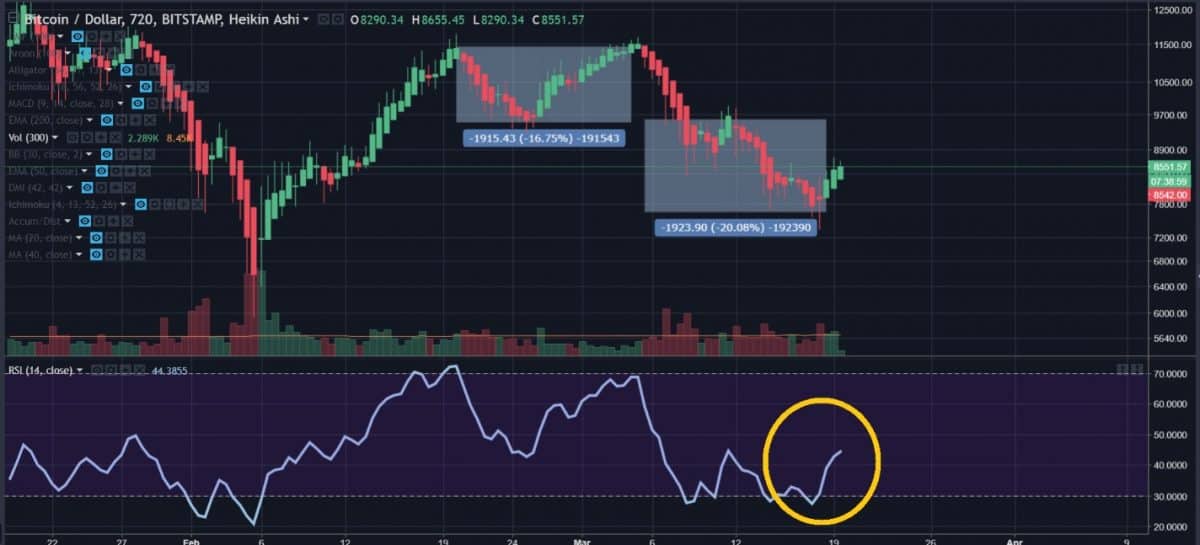
Here we can see the RSI began its trek upward on the 12-hour chart before the candles finally turned green (divergence).
However, investors/traders must remain cautious due to the resistance overhead at $8,500 that bitcoin is currently struggling with.

This $8,500-$8,700 level has been tested numerous times, making it a very reliable point of support (if price breaks above) as well as a very reliable point of resistance (if the price is below). Currently, the price is below it, and the rally from $7,500 has stagnated significantly at this point.

However, the volume accompanying this price movement is above the 20-period volume average signified by the orange line above. Thus, there is potential that momentum may exist to continue to push bitcoin upward.
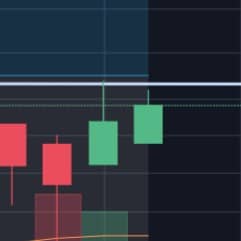
While rarely discussed, the last two green candlesticks on the daily chart present themselves as evidence of bullish sentiment as well.
The change from the first green wick to the second on the daily chart shows less volatility and a more definitive resolution on a move upward for the market, which is a positive sign. Also:

This long wick on the last red candle before the two green ones that we see at the end shows a substantial amount of volatility in the price. Also, given the fact that it is so long, we see that the bears were unsuccessful in attempting to pull the price further downward with them.
Although none of these patterns represent bullish reversals, they are both positive signs.
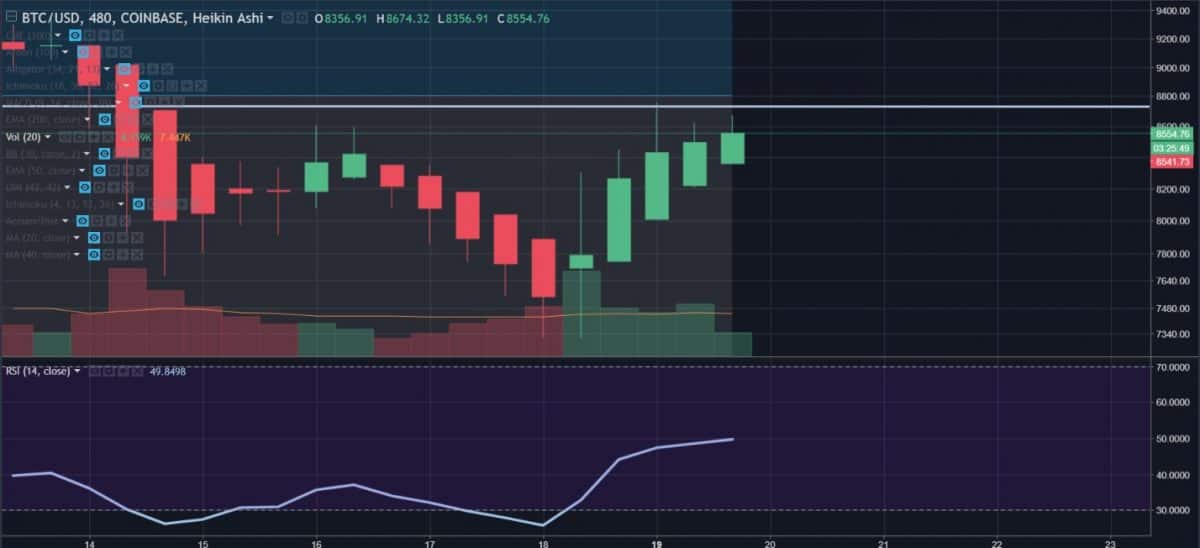
Here is the 8-hour chart displaying the RSI as well as the price movement. As one can see, the volume is beginning to decrease while the price increases and the momentum of the RSI is beginning to wane ever so slightly.
Given this fact in conjunction with the resistance that is right above the ‘head’ of the price currently, one should be very vigilant for an imminent reversal back downward as the bears continue to ‘rest up’ after being exhausted once more.

The bottom line is the rate of change (2) for the RSI. The peak occurred on March 18. Since then, the rate of change has gone down substantially – showing that the increase in the RSI has increased substantially as well.
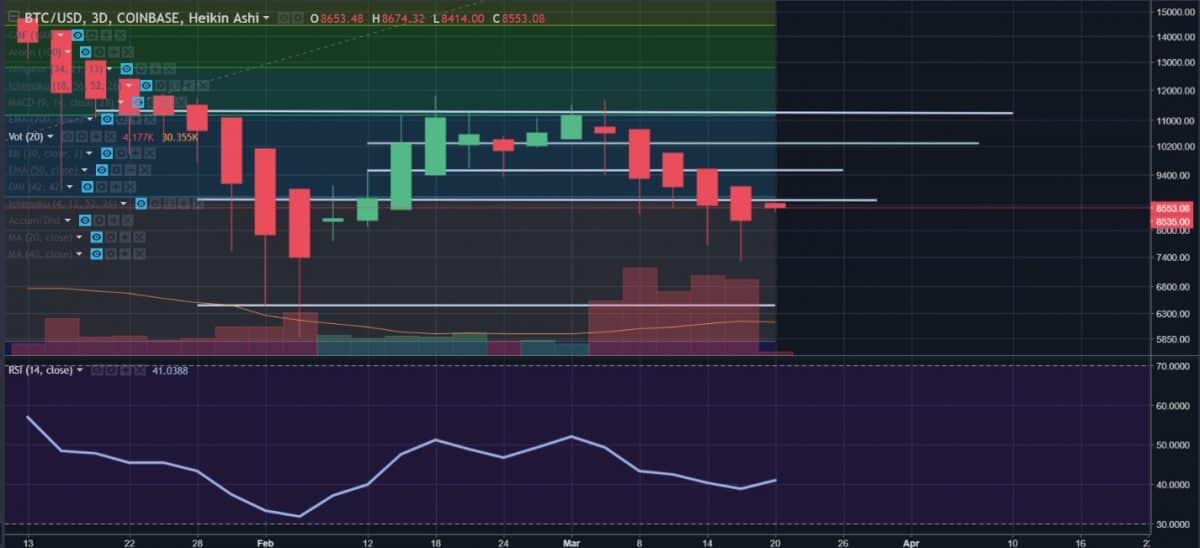
Above is the RSI on the 3-day chart for bitcoin. What is interesting here is that the RSI here has yet to fall into the ‘oversold’ portion during this entire bear market run.
So What’s the Verdict?
The bulls are running out of time to break past the $8,500 price resistance. If they are able to do so successfully, then the price could potentially make a run up to $9,500 (next major resistance).
However, if the bulls fail to do so and get rejected at the $8,500 mark (which becomes increasingly likely the more it stagnates there, and the RSI decreases), then a trip back down to $7,800 then $7,500 is more than likely. There is still a lot of heavy bear sentiment and momentum within bitcoin at the present moment.
The G20 summit has led some in the sphere to remain optimistic that positive news from there will spur the price onward. However, it appears that any bullish sentiment stemming from this meeting has already been priced in.
Unbiased Recommendation: If you aren’t already in bitcoin, the author would personally refrain from trading. If you are already in bitcoin, remain wary of a potential decrease in price and set a stop loss around the $8,250-8,300 mark in order to protect yourself against steep losses.
Those that missed the jump from $7,500-$8,500, do not be alarmed – there is still an opportunity to gain via investing in a stablecoin ($NBT if the price decreases) or through tracking other coins that gain inversely to BTC’s decline in price if it does go down.
Disclaimer: The author is not a financial advisor and is only speculating based on my personal opinion and research. Trade at your own risk.


