Bitcoin price falls below $64K as US CPI fails to spark breakout


Bitcoin price fell nearly 3% from an intraday high of $65,234 to $63,304 as an expected U.S. inflation report failed to push the asset beyond its established trading range.
- Bitcoin price remained inside its $62,000–$66,000 range after July inflation matched forecasts.
- 4-hour momentum remains weak, with BTC trading below its Bollinger Band midpoint.
- Liquidation clusters near $64,700 and $62,800 could shape Bitcoin’s next move.
- CoinEx analyst Jeff Ko said weaker employment data affected rate expectations more than CPI.
Bitcoin price action today
According to data from crypto.news, Bitcoin (BTC) price traded near $63,600 at the time of writing after briefly reaching $65,234, leaving the asset about 3% below its intraday high. The move followed the release of U.S. inflation data that largely matched economists’ forecasts and offered traders no major upside surprise.
The U.S. Bureau of Labor Statistics reported that headline inflation rose 0.1% month over month in July and slowed to 3.4% annually from 3.5% in June. Core CPI, which excludes food and energy, increased 0.2% during the month and 2.5% from a year earlier.
CoinEx Chief Analyst Jeff Ko told crypto.news that the figures produced only a limited change in financial conditions. Treasury yields declined after the release, but the 10-year yield remained elevated near 4.68%, while the U.S. dollar weakened slightly.
“July CPI landed almost exactly on consensus. Headline CPI rose 0.1% month-on-month and 3.4% year-on-year, down from 3.5% in June, while core CPI increased 0.2% month-on-month and 2.5% year-on-year,” Ko said.
Bitcoin’s inability to hold above $65,000 supports a sell-the-news interpretation. Traders had pushed BTC toward the upper end of its recent range before the inflation release, but the expected reading provided little reason to increase short-term exposure.
Why expected CPI failed to lift Bitcoin
Ko said Bitcoin’s subdued reaction showed that traders had already accounted for the inflation slowdown before the official report arrived.
“The muted market reaction suggests the CPI print was largely priced in,” Ko told crypto.news.
BTC has traded mainly between $62,000 and $66,000 in recent weeks as institutional demand competes with sales by miners and corporate holders. Trading volume and implied volatility have also declined, limiting the market’s ability to sustain moves outside that range.
Strategy added to the selling pressure after disclosing the sale of 1,690 BTC for $108.6 million at an average price of $64,262. The transaction marked its fourth consecutive week of Bitcoin sales, bringing the 4-week total to 6,916 BTC worth about $429.4 million.
Institutional flows had shown improvement before the latest decline. Ko told crypto.news on Wednesday that U.S. spot Bitcoin exchange-traded funds attracted roughly $850 million during the previous week, their strongest weekly result since April. crypto.news previously reported $854 million in weekly inflows, led by approximately $694 million entering BlackRock’s IBIT.
Ko had described BTC near $65,000 as an “absorption phase,” in which returning institutional demand was being met by existing selling. The subsequent failure to break $66,000 means the transition from accumulation into a stronger markup phase remains unconfirmed.
Jobs data had a greater effect on rate expectations
Ko said the weak July employment report created a larger change in interest-rate expectations than the in-line CPI reading. U.S. nonfarm payrolls fell by 23,000 in July, compared with expectations for an increase of about 80,000, while May and June gains were revised down by a combined 103,000.
“The weak July jobs report arguably mattered more for the rates outlook in a way that rate futures cut the probability of a September hike from around 57% to roughly 44% after the payrolls miss, a bigger repricing than we saw following the in-line CPI data.”
The analyst estimated that the probability of a September rate increase declined further from about 48% to the low-40% range following CPI. A lower likelihood of immediate tightening can support risk assets, but the continued elevation in Treasury yields has limited that benefit for Bitcoin.
July producer prices offered another mixed signal on Thursday. The Bureau of Labor Statistics said the Producer Price Index was unchanged during the month after falling 0.1% in June, although final-demand prices remained 4.7% higher year over year.
Ko identified July PCE, August CPI, and the Federal Reserve’s Sept. 15–16 meeting as the next major U.S. catalysts. He also warned that July CPI mostly predates the latest increase in geopolitical and oil-price risks, which could feed into future inflation readings.
Bitcoin technicals favor sellers below $64,000
Bitcoin’s daily chart shows the price near $63,637 and below the 20-day simple moving average at approximately $64,079. BTC is also below the 100-day and 200-day averages near $67,285 and $69,670, respectively, keeping the broader recovery under pressure.
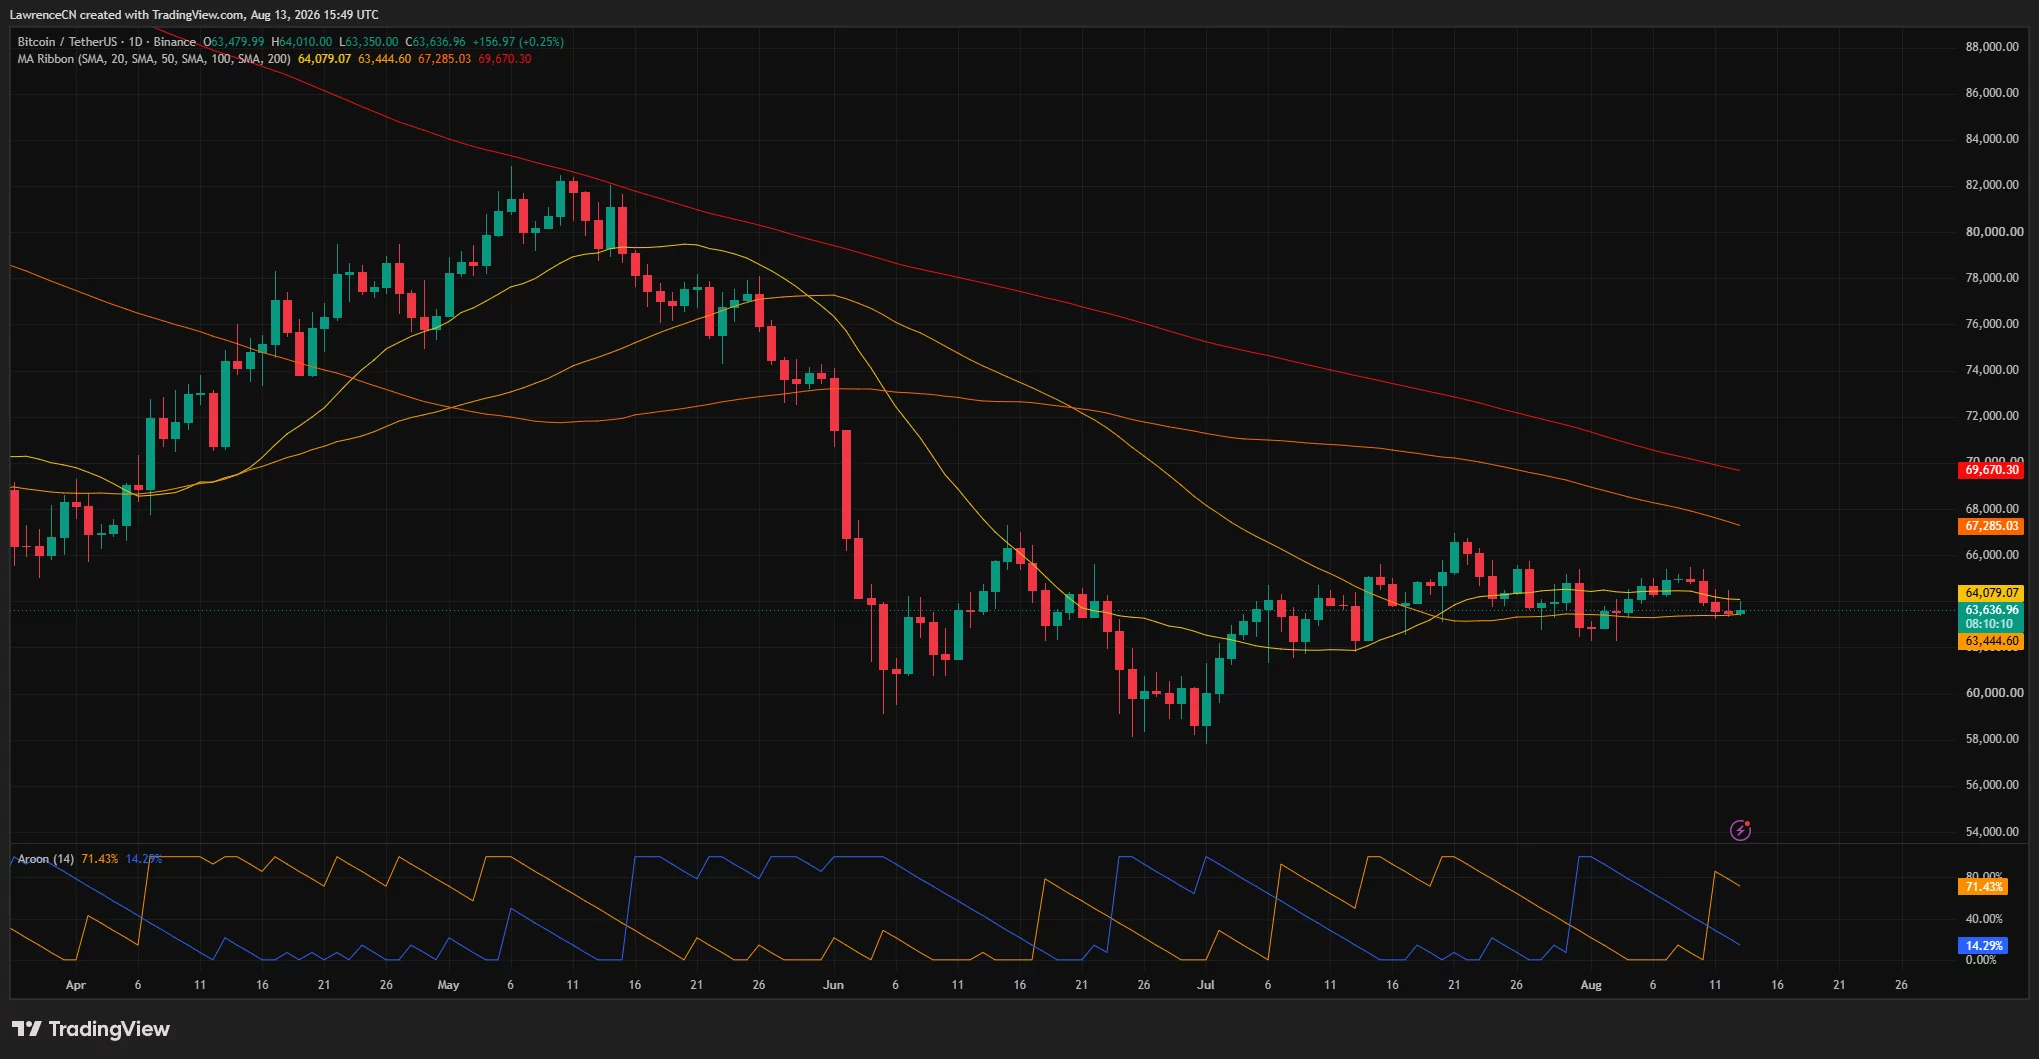
The 50-day average sits near $63,445, placing BTC just above a short-term support area. A daily close below that level would weaken the current range and expose the psychological $63,000 mark.
Aroon readings add to the bearish setup. Aroon Down stands at 71.43%, compared with Aroon Up at 14.29%, showing that recent lows carry more influence than recent highs.
On the 4-hour chart, Bitcoin trades below the Bollinger Band midpoint at $63,885. The lower band near $63,064 provides immediate support, while the upper band around $64,705 overlaps with the first major recovery target.
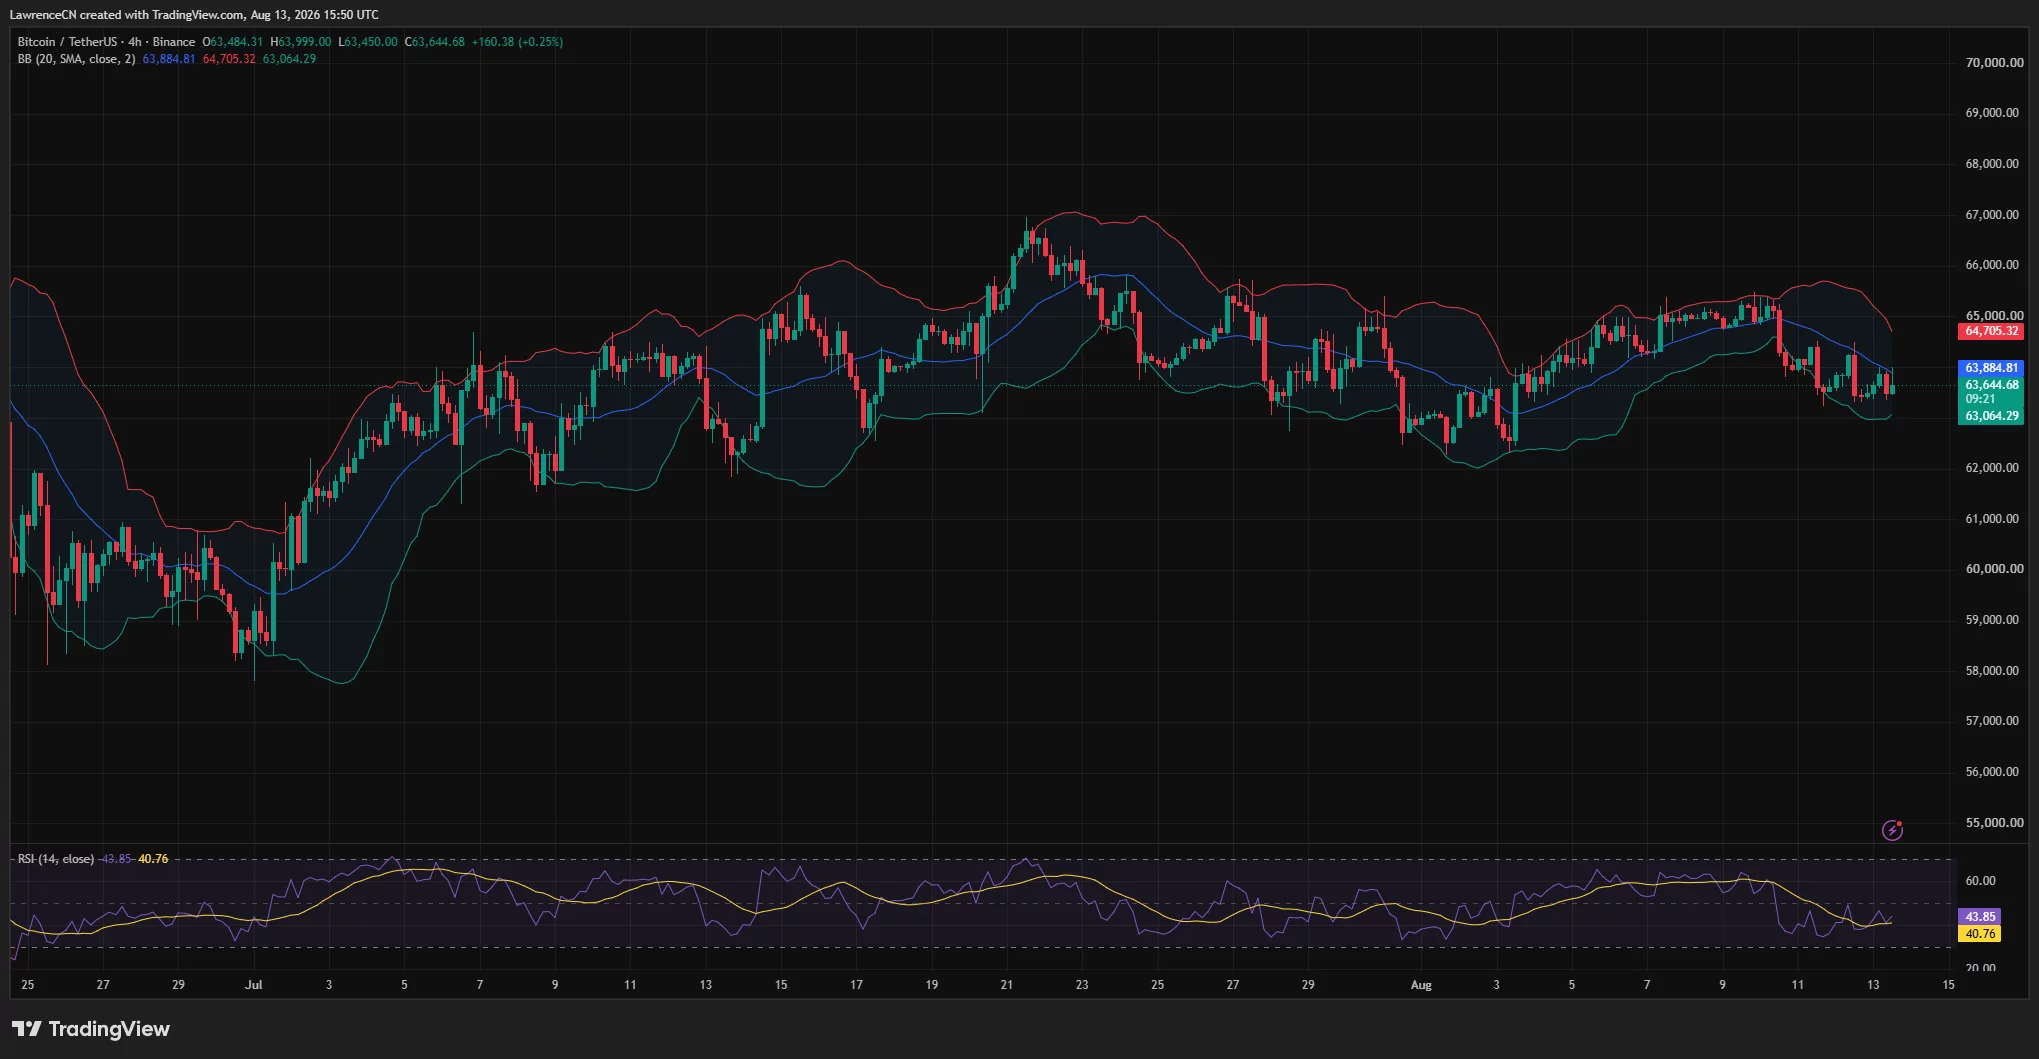
The 4-hour relative strength index stands at 43.85. The reading points to weak momentum but has not reached oversold territory, leaving room for further selling if $63,000 fails.
Liquidation levels frame Bitcoin’s next move
CoinGlass’ three-day liquidation heatmap shows a large concentration of leveraged positions around $64,500–$64,700. A recovery above $63,900 could draw BTC toward that liquidity before another attempt at $65,000.
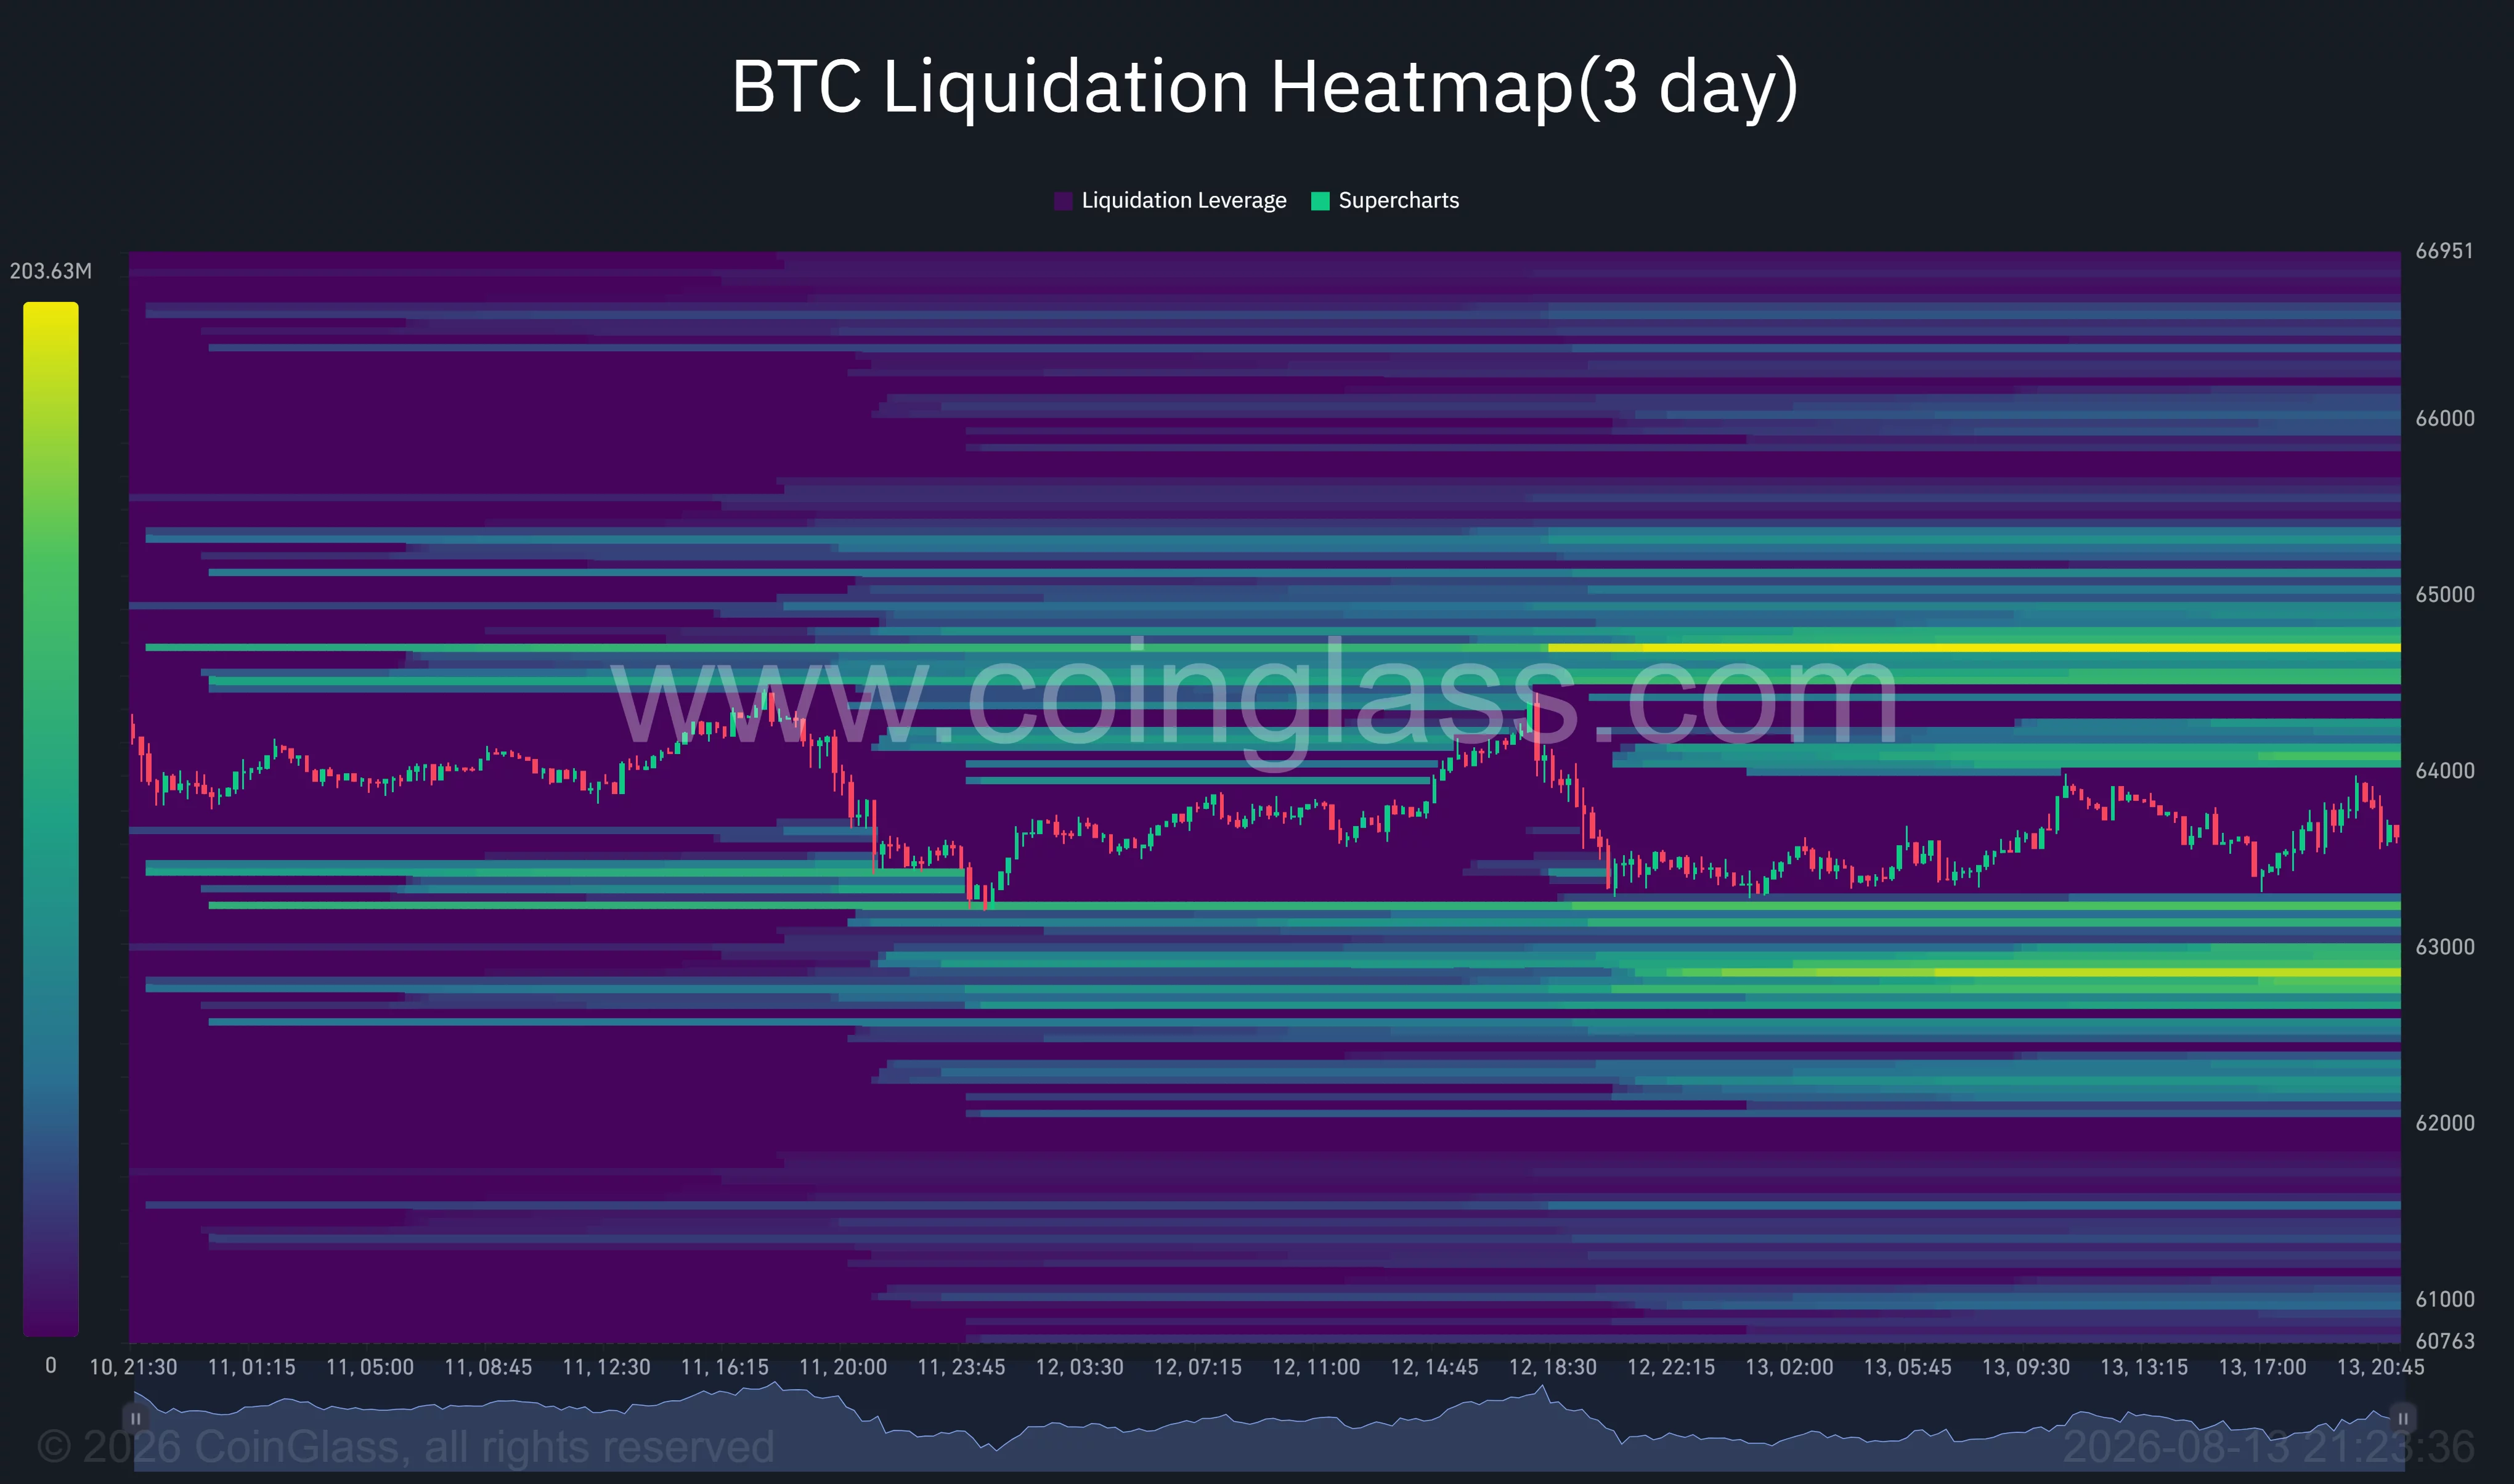
A second cluster sits around $62,700–$62,900. Losing the lower Bollinger Band and $63,000 support could trigger forced long closures and pull the price toward that area. Further support lies between $61,000 and $62,000.
CryptoQuant contributor Rain said about 45%–46% of Bitcoin’s supply is currently held at an unrealized loss, a condition the analyst associated with periods of deeper market stress. Rain identified $61,000–$62,000 as the key area to defend and projected a possible move toward the low-$50,000 range if that support fails.
Ko said a stronger crypto recovery would require several macro and market signals to align.
“For crypto, the strongest confirmation would be falling real yields, a weaker dollar, and improving ETF/stablecoin flows at the same time.”
Bitcoin must first reclaim $63,900 and $64,700 to improve its short-term structure. Failure to hold $63,000 would instead place the $62,700 liquidity pool in focus, keeping BTC within the broader range that has restricted its price since July.
Disclosure: This article does not represent investment advice. The content and materials featured on this page are for educational purposes only.