Chart of the week: XRP could jump another 12%, what to expect
XRPLedger’s native token (XRP) gained 12% on Nov. 29 as the altcoin held steady above $1.7300, rallying alongside Bitcoin (BTC), Ethereum (ETH), Dogecoin (DOGE), and other leading cryptocurrencies.
Table of Contents
XRP on-chain indicators signal price growth
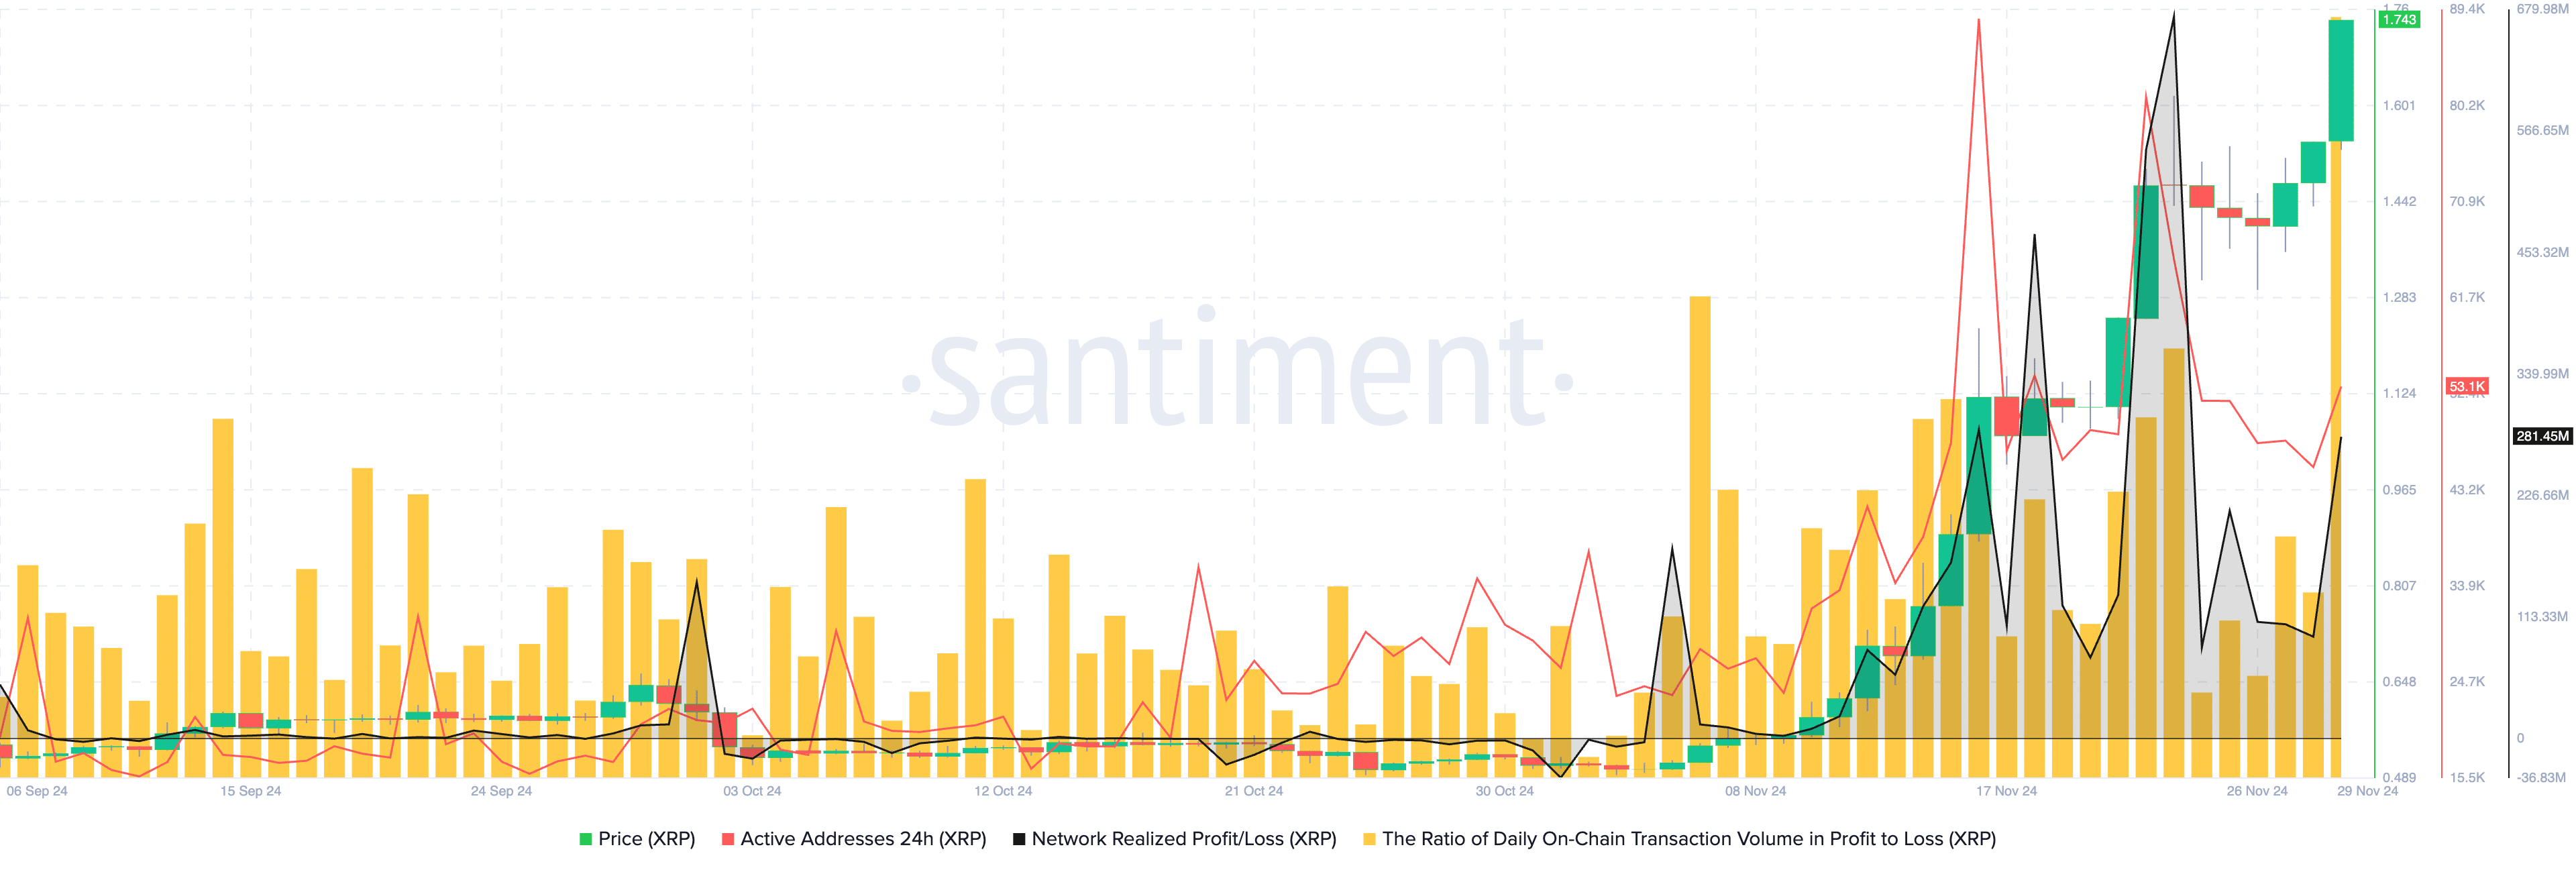
XRP traders increased their on-chain activity between Nov. 16 and 29, and Santiment recorded several spikes in the active addresses metric. The spikes represent the increase in activity, accompanied by a spike in transaction volume across exchange platforms.
The network realized profit/loss metric used to identify the net profit/loss of all tokens traded on a given day shows that XRP traders have been transacting profitably since Nov. 4. Positive spikes above the neutral line indicate traders’ profit-taking.
Typically, large positive spikes are associated with the likelihood of higher selling pressure on XRP; traders need to watch this metric closely for signs of a reversal in trend.
The ratio of daily on-chain transaction volume in profit to loss is 6.73, meaning profitable transactions are dominant as XRP price rallies.
The on-chain metrics support a bullish thesis for XRP price alongside technical and other indicators.
XRP eyes retest of April 2021 peak
Technical indicators show the likelihood of an extended price rally and a retest of $1.9669, the April 2021 peak for the altcoin — a 12.85% rise from the current level. A successful break past this level could erase the losses for traders for the past three years.
The relative strength index reads 88, meaning XRP is overvalued. While typically, this is considered a sell signal and could indicate an impending correction in XRP, the moving average convergence divergence (MACD) indicator signals further gains are likely.
Green histogram bars above the neutral line support a thesis of XRP price rally.
The $3 target is a psychologically important level for XRP; in January 2018, the altcoin hit a record high at $3. The altcoin has yet to revisit the level in the past six years.
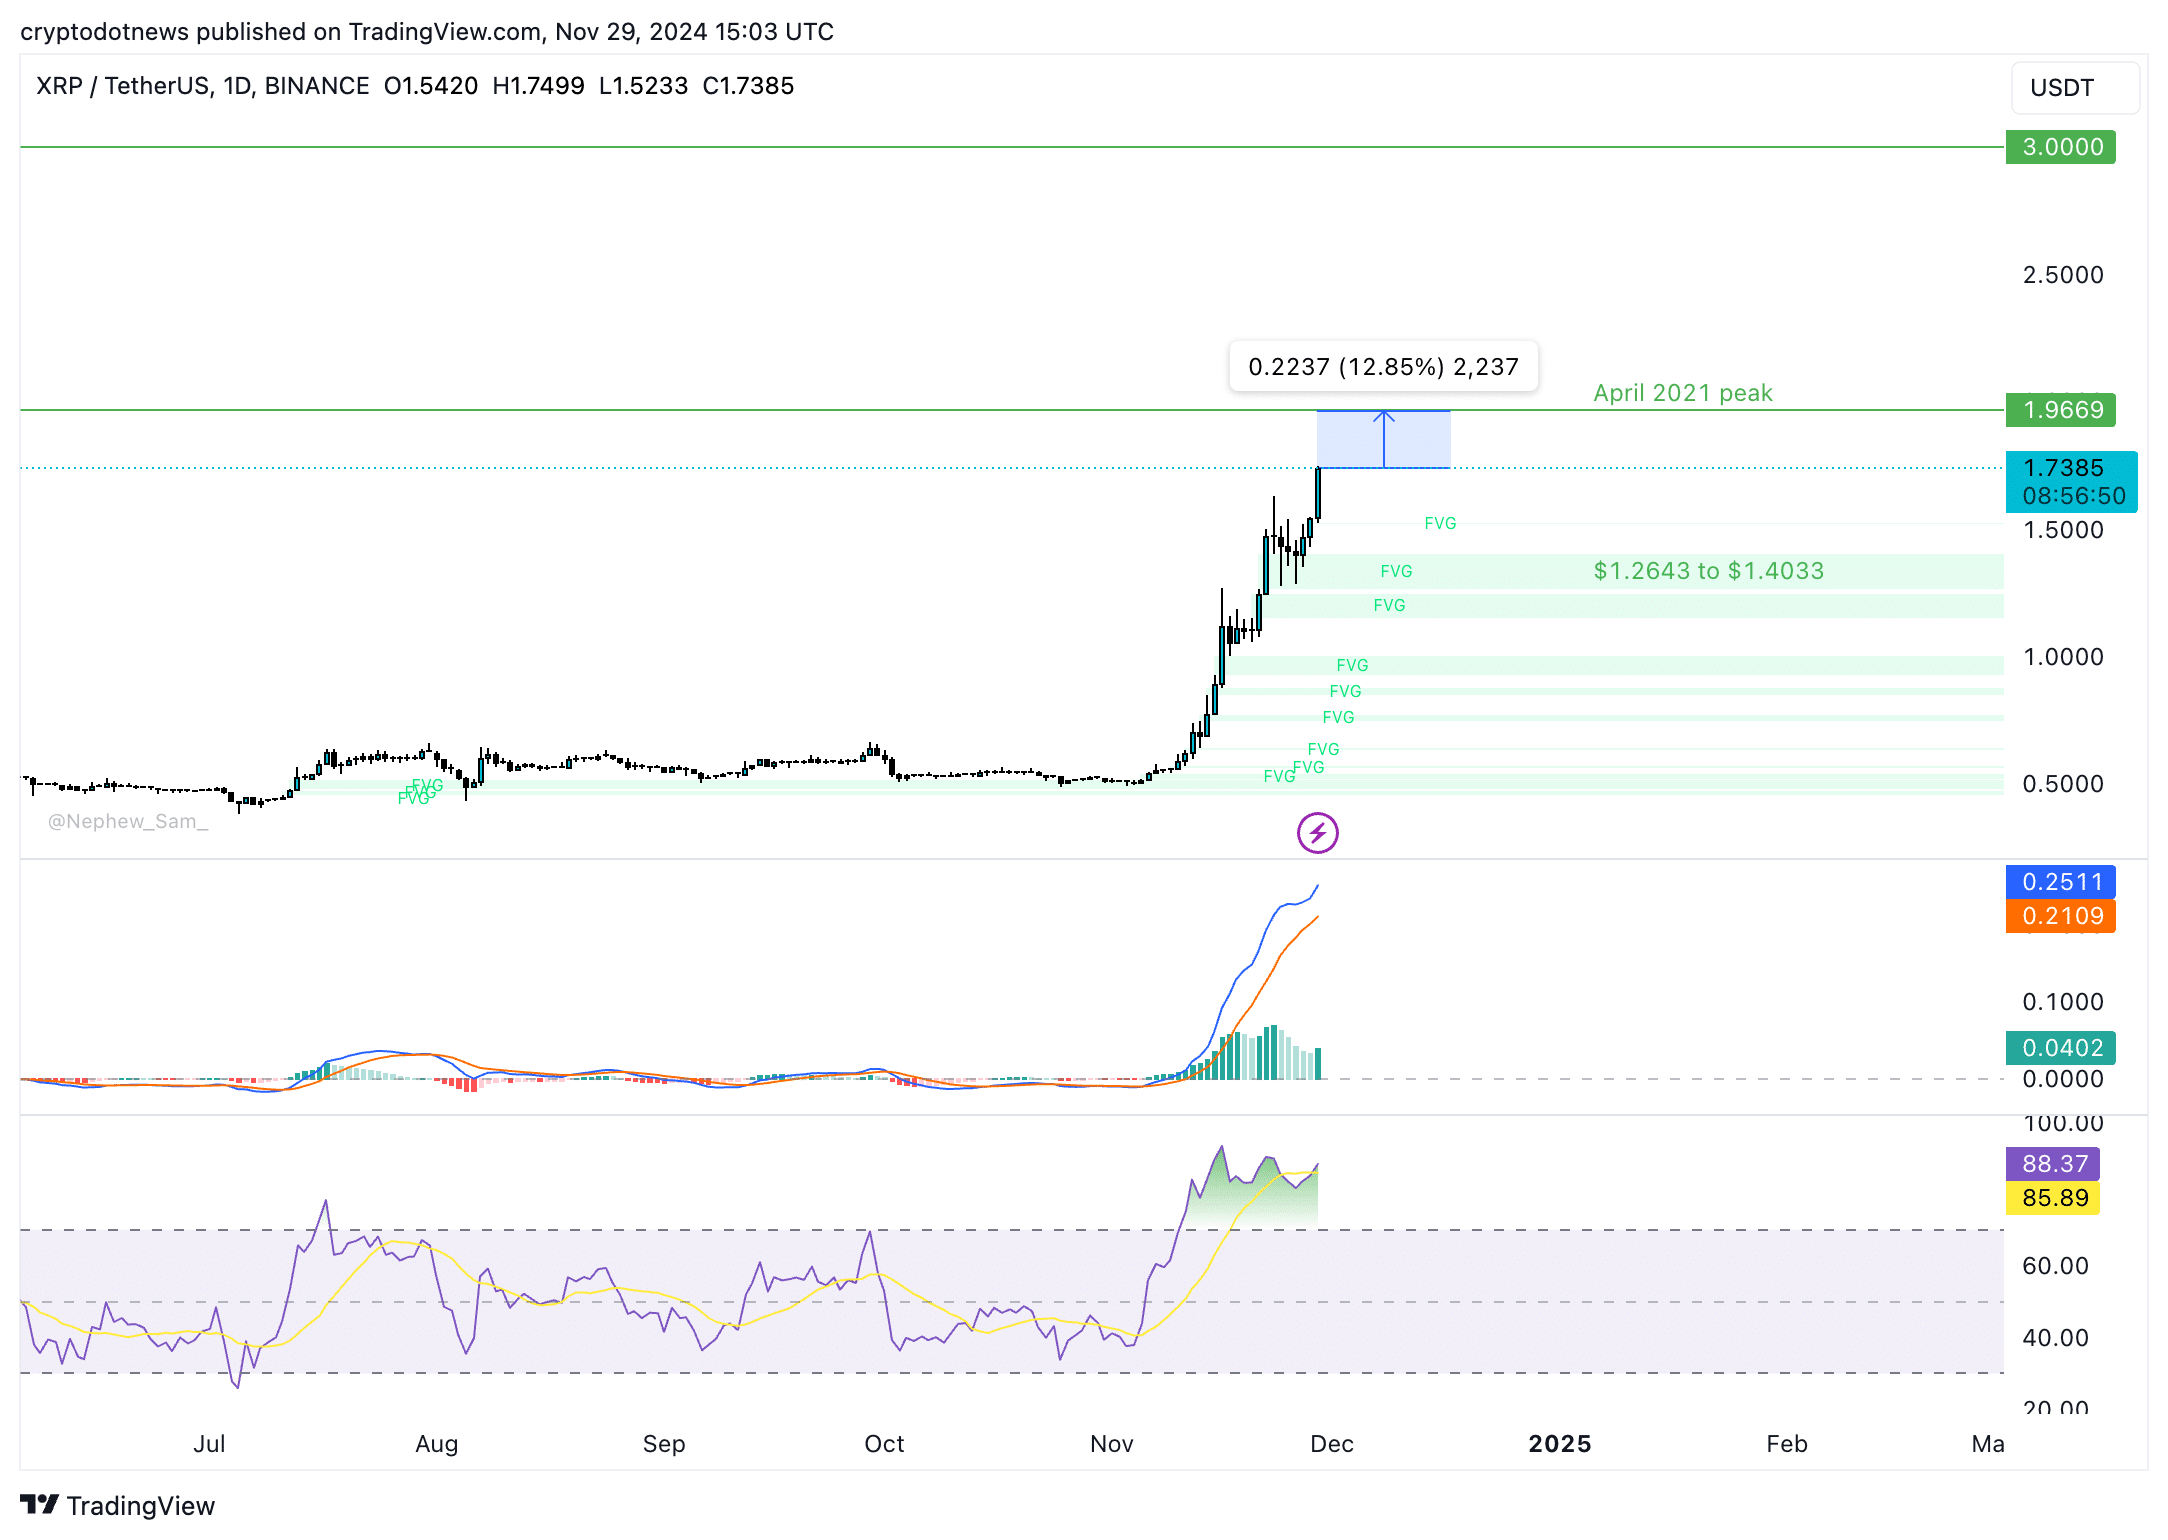
XRP could find support between $1.2643 and $1.4033 in the imbalance zone. A correction could send the altcoin to this support zone before further correction. Once the fair value gap is filled, XRP could resume its climb toward the April 2021 peak of $1.9669.
XRP derivatives traders turn bullish
Coinglass data shows XRP derivatives traders on Binance and OKX are bullish on the altcoin. There is a likelihood of a rally in the spot market as derivatives traders’ long/short ratio crosses 1 on major exchanges.

The open interest in XRP futures crossed $2.41 billion on Nov. 29. A rise in open interest is a sign of a higher relevance of the token and its rising demand among market participants.

Strategic considerations
XRP’s three-month correlation with Bitcoin is 0.82, according to Macroaxis.com. This metric shows that a significant market movement in Bitcoin could impact the XRP price.
Bitcoin started its recovery after the initial drawdown to the $90,700 level on Tuesday. If BTC records a major decline in its price in the coming weeks, the XRP price trend could be negatively impacted.
Other market movers for XRP are the U.S. Securities and Exchange Commission’s lawsuit against Ripple and progress in regulatory clarity on crypto in the states.
Disclosure: This article does not represent investment advice. The content and materials featured on this page are for educational purposes only.


