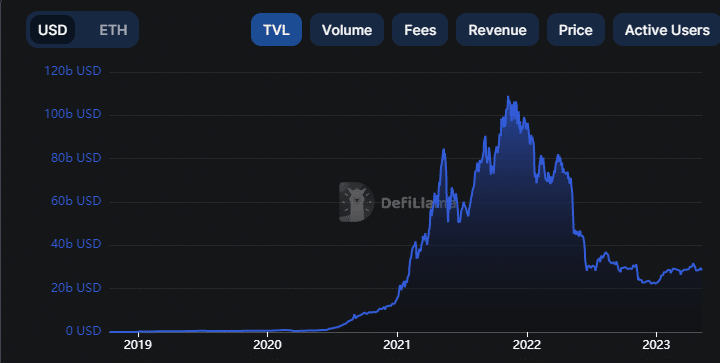
Ethereum’s total value locked hits new all-time high


The quantity of locked ethereum just hit 19,375,242 ETH, setting a new all-time high for the cryptocurrency. The total value locked (TVL) currently stands at $27.7 billion.
This milestone comes after what may be regarded as a “dip for ants” after the recent withdrawals. This accomplishment has essential repercussions for ethereum and its investors, especially regarding the possibility for the cryptocurrency to continue its rapid expansion.
The ether that has been locked up may be broken down into various categories, including ether that has been staked on the Beacon chain, ether that has been transferred to the Beacon contract but is not yet validating, and ether that has been rewarded on the Beacon chain.
These categories, when taken together, indicate the amount of ETH that is “out of circulation,” which reduces the total amount of ETH that is accessible, hence possibly increasing both demand and price.
As more investors put their ethereum (ETH) on the Beacon chain, it demonstrates their trust in Ethereum’s capacity to survive in the long run and its potential for expansion. This tendency could help Ethereum establish itself as the dominant platform for smart contracts and cryptocurrencies.
When looked at from a broader perspective of the Ethereum ecosystem, recent withdrawals seem like relatively small moves. Despite some very insignificant shifts, the amount of locked ETH has continued to increase, which suggests that the cryptocurrency’s general health is still in good shape. Analyzing the market’s swings should serve as a helpful reminder to investors of the importance of a long-term view.
The total quantity of locked ETH will continue to increase as Ethereum 2.0 is being developed further and the shift to a proof-of-stake (PoS) paradigm becomes more firmly entrenched.
Ethereum price today
Ethereum faces much resistance at $1.900 levels as the asset recorded a loss of close to 15 within 24 hours. Trading at $1.847 as of writing, the cryptocurrency has gained 0.17% in price, with the trading volume up by 2.85%, according to CoinMarketCap data.
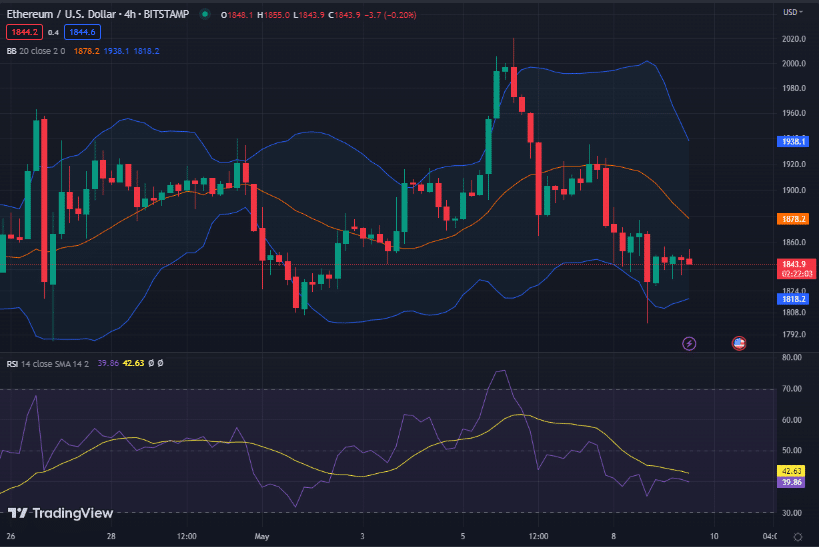
Ethereum’s volatility levels are rising as the Bollinger bands strategy, used to estimate volatility levels, moves far away from each other. The RSI, now moving below its average line, is signaling a bearish trend as it approaches the oversold region.