Pepe Coin price forms a risky pattern as whale selling intensifies

Pepe Coin’s price remains under pressure this week and is at risk of further downside after the token formed a descending triangle pattern and as selling intensifies.
- Pepe Coin price has formed a giant descending triangle pattern on the daily chart.
- Whale and smart money investors have continued selling the coin.
- The futures open interest has plunged to a multi-month low.
Pepe (PEPE), the third-biggest meme coin after Dogecoin and Shiba Inu, fell to a low of $0.000009205, its lowest level since June 24. The token has tumbled by almost 50% from its highest level this year.
One of the main reasons Pepe’s price has tumbled is that whales have continued to sell the token heavily. They now hold 6.54 trillion tokens, down from 7.6 trillion tokens.
The same selling has continued among the so-called smart money investors, who now hold 1.62 trillion tokens, down from 2.6 trillion in August. Whale and smart-money selling is often seen as a bearish sign for a token, as these investors have a long track record of success in the crypto industry.
More metrics show that demand for Pepe tokens has continued to fall in the past few months. For example, futures open interest dropped to $557 million on Tuesday from $800 million earlier this month and more than $1 billion in July.
Falling open interest is usually a sign of low demand among investors. The same decline has also happened in the spot market, where daily volume has continued to fall in the past few months.
Pepe Coin price technical analysis

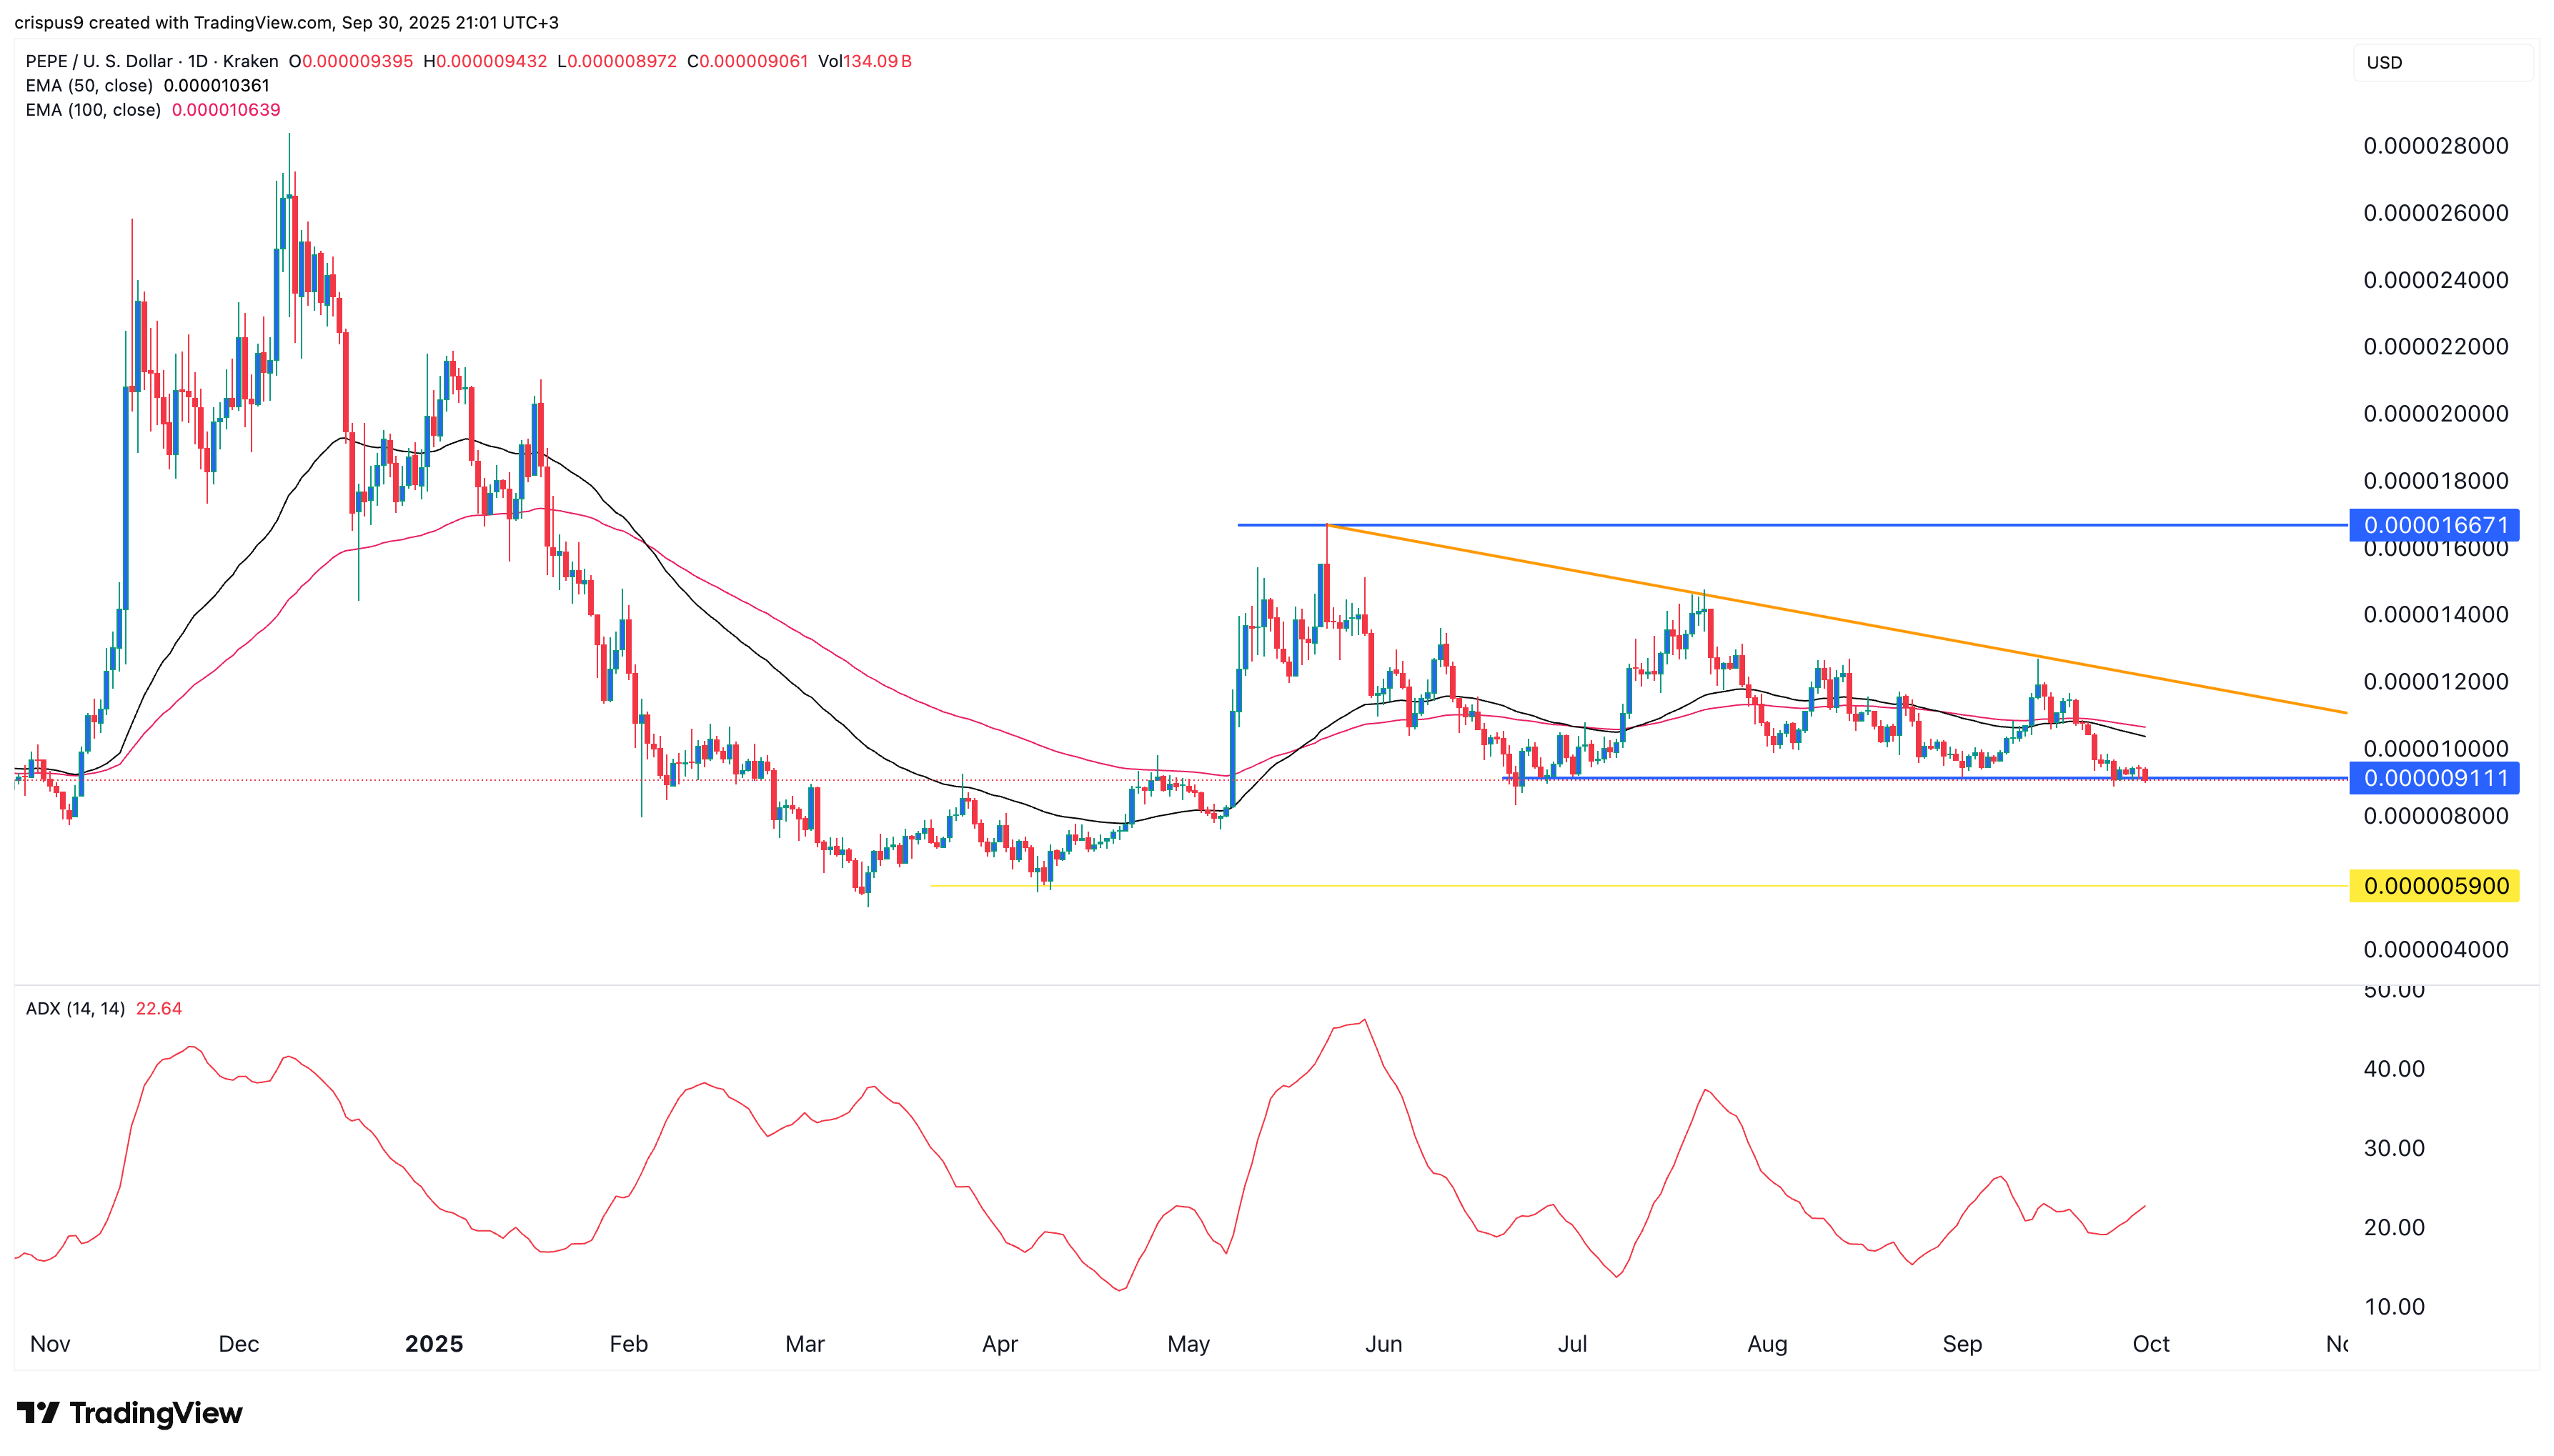
The daily timeframe chart shows that Pepe’s price has come under pressure in the past few months, falling from a high of $0.00001667 in May to a low of $0.0000091 today. This price is notable since it coincides with the horizontal line that connects the lowest swings since June this year.
Pepe has formed a descending triangle pattern, a common bearish continuation pattern made up of horizontal support and a descending trendline. In this case, the trendline connects the swing highs on May 22, July 22, and Sep. 13.
Pepe Coin’s price has moved below the 50-day and 100-day Exponential Moving Averages, while the Average Directional Index has risen, a sign that the retreat is gaining momentum.
Therefore, the coin will likely continue to fall as sellers target the next key support level at $0.0000059, the April 6 low.


