Robinhood Chain app revenue tops Ethereum in 24 hours


Robinhood Chain recorded $2.66 million in application revenue over 24 hours on Aug. 31, according to a rolling DeFiLlama dashboard.
- Robinhood Chain recorded $2.66 million in rolling daily app revenue during the cited DeFiLlama snapshot.
- That snapshot placed Robinhood Chain above Hyperliquid, Ethereum and Base for aggregated application revenue temporarily.
- GMGN, Pons and Uniswap generated approximately 93% of Robinhood Chain’s measured daily application revenue combined.
- Rolling twenty-four-hour figures change continuously as new activity enters and older transactions leave calculation windows.
- App revenue measures earnings retained by protocols, not revenue received directly by Robinhood’s corporate business.
The reading placed the network above Hyperliquid L1 at $1.71 million, Ethereum at $1.57 million and Base at approximately $439,252. Robinhood Chain’s total was roughly 6.1 times Base’s figure during the same snapshot.
The dashboard had shown lower totals earlier in the day. That difference reflects the rolling measurement window rather than a correction or separately reported financial result.
Robinhood Chain app revenue led the snapshot
DeFiLlama’s dashboard aggregates revenue retained by applications operating on each network. Its Robinhood Chain reading increased 201% from the previous week and reached $23.23 million over 30 days.
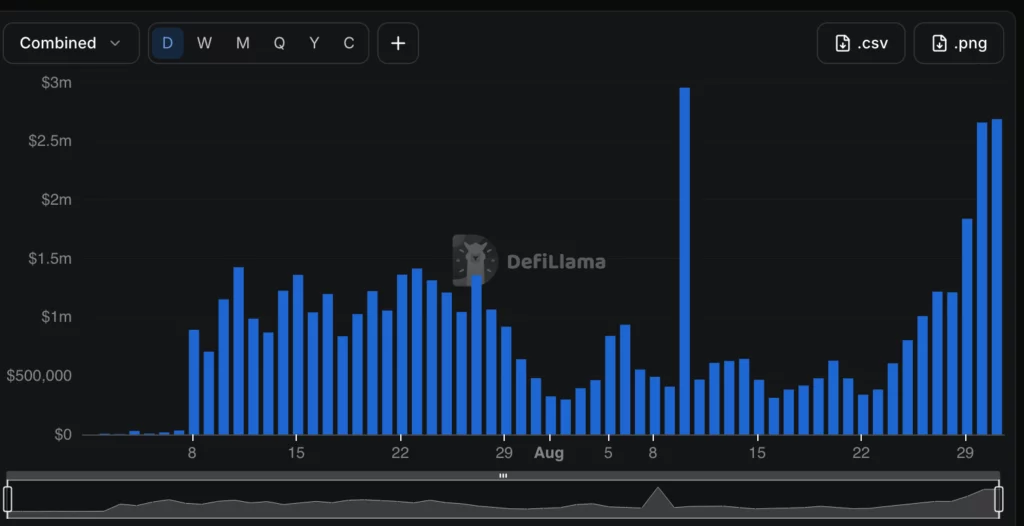
However, the 30-day comparison presented a different ranking. Hyperliquid L1 recorded $53.6 million, while Ethereum generated $52.03 million. Robinhood Chain therefore led the daily snapshot but remained behind both networks over the longer period.
The comparison also does not mean Robinhood Markets earned more revenue than Ethereum or Hyperliquid. Application revenue belongs to individual protocols and may include several measurement methods, depending on how each service collects fees.
Three applications generated about 93% of revenue
GMGN led Robinhood Chain applications with approximately $1.11 million in 24-hour revenue. DeFiLlama defines that figure as trading fees retained by GMGN after referral commissions. Its EVM referral deduction is partly estimated using the rate measured on Solana.
Pons followed with approximately $1.03 million. Its total includes launch fees and portions of swap fees retained by the protocol. Uniswap ranked third with about $327,707.
Together, the three applications generated nearly $2.47 million, equivalent to approximately 93% of Robinhood Chain’s reported total. The concentration shows that the daily result depended heavily on trading bots, token launches and decentralized exchange activity.
Pons has been expanding its Robinhood Chain presence through an ETH-based bonding curve and Uniswap v4 integration
App revenue differs from blockchain revenue
Application revenue measures fees retained by protocols after payments to liquidity providers, referrers or other participants. It differs from gross user fees, transaction volume and revenue retained by the underlying blockchain.
DeFiLlama separately estimated Robinhood Chain’s own 24-hour revenue at about $963,612. Its definition covers transaction gas fees after Ethereum execution costs, blob costs and the Arbitrum Expansion Program share.
The distinction matters because Robinhood Chain is an Ethereum-compatible Layer 2 built with Arbitrum technology. Robinhood launched its public mainnet on July 1 for tokenized assets and decentralized financial applications.
Uniswap became one of its main liquidity venues at launch. In related coverage, crypto.news reported that cumulative tokenized-stock trading through Uniswap had surpassed $1 billion by Aug. 21.
Longer data will test whether the lead continues
Robinhood Chain would need to maintain stronger seven-day and 30-day results before the daily reading could indicate a sustained change in network rankings. Daily revenue can rise sharply during token launches or periods of concentrated speculative trading.
Future assessments should examine whether revenue spreads across more applications, whether active users continue returning and whether transaction activity persists without short-term incentives. GMGN and Pons currently account for most of the total, making the network sensitive to changes in either platform.
The earlier $1.84 million reading and the later $2.66 million total demonstrate how quickly a rolling dashboard can change. Articles comparing networks should therefore identify the measurement time and avoid presenting the figure as a completed financial period.