Solana’s unprecedented 200% pump is likely caused by short squeeze


Solana (SOL) has grown quickly over the last two years to rank among the top blockchains in market capitalization and usage. Yet Solana was the crypto platform most adversely impacted by the FTX meltdown.
Even though Solana finished 2022 on the verge of collapse and hit a 52-week low of $8.14 on Dec. 29, market sentiments have since changed in favor of Solana and its native token SOL.
SOL price soon recovered after hitting bottom and increased by more than 204%, reaching a 30-day high of $24.75 on Jan. 16.
As of 18 January, SOL has a market capitalization of $8.58 billion and was trading at $22.33 with a $902 million 24-hour trading volume. So how much farther can SOL go, and what’s creating this pump? Let’s investigate.
Short squeeze gains
According to Santiment, an on-chain analytics company, the abrupt rise in Solana’s price might have been caused by a short squeeze.
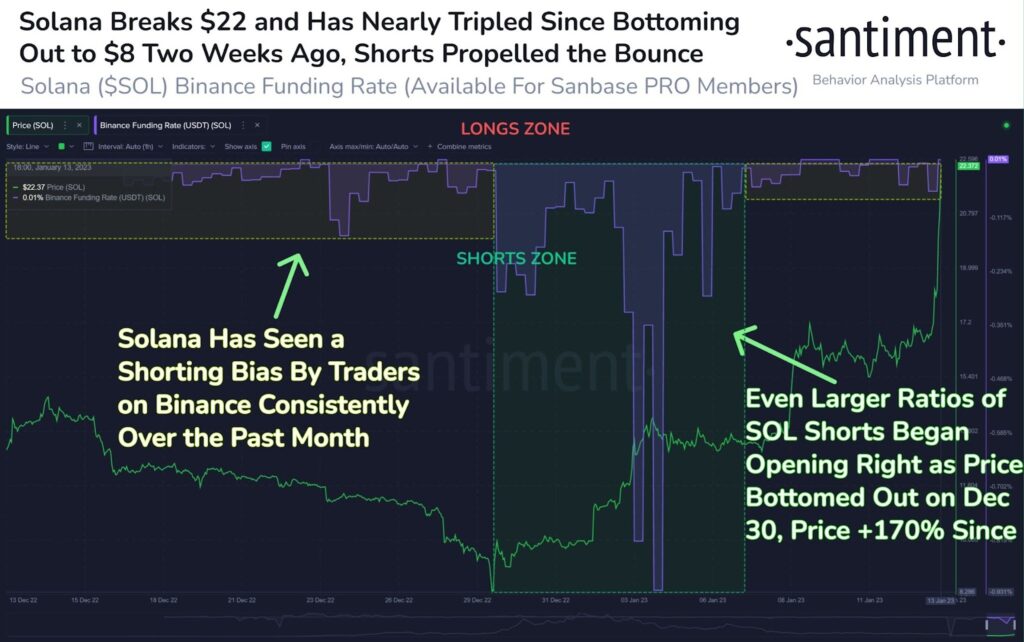
A short squeeze occurs when the price of an asset abruptly increases, leading short sellers to begin purchasing shares to limit their losses. This purchasing activity drives the asset’s price to increase even more, causing additional short sellers to cover their positions and generating a self-perpetuating loop.
As a result, when the price of SOL began to rise suddenly, traders hurriedly purchased the asset at a higher price to square off their positions, causing an infusion of demand that pushed up the value even more.
However, it is crucial to highlight that short squeezes are not necessarily triggered by fundamental issues but may also be influenced by market emotion, rumors, speculations, and manipulation.
Launch of BONK
The launch of the Shiba Inu-themed token Bonk (BONK), built on the Solana blockchain, offered a significant impetus for the growth of SOL.
To further promote the usage of their new digital currency, Bonk conducted an airdrop of their token supply, distributing 50% of their total supply to certain wallet addresses.
This airdrop had a dual purpose. First, as 20% of the supply was allocated to Solana NFT collections, comprising 297,000 individual NFTs, and 10% went to Solana-focused artists and collectors, it stimulated further interest in the Solana community. Consequently, it drove the price of SOL and BONK.
What’s happening with on-chain metrics?
Number of active addresses
According to the Block, Solana (SOL) has demonstrated substantial growth in active addresses since the start of the year.
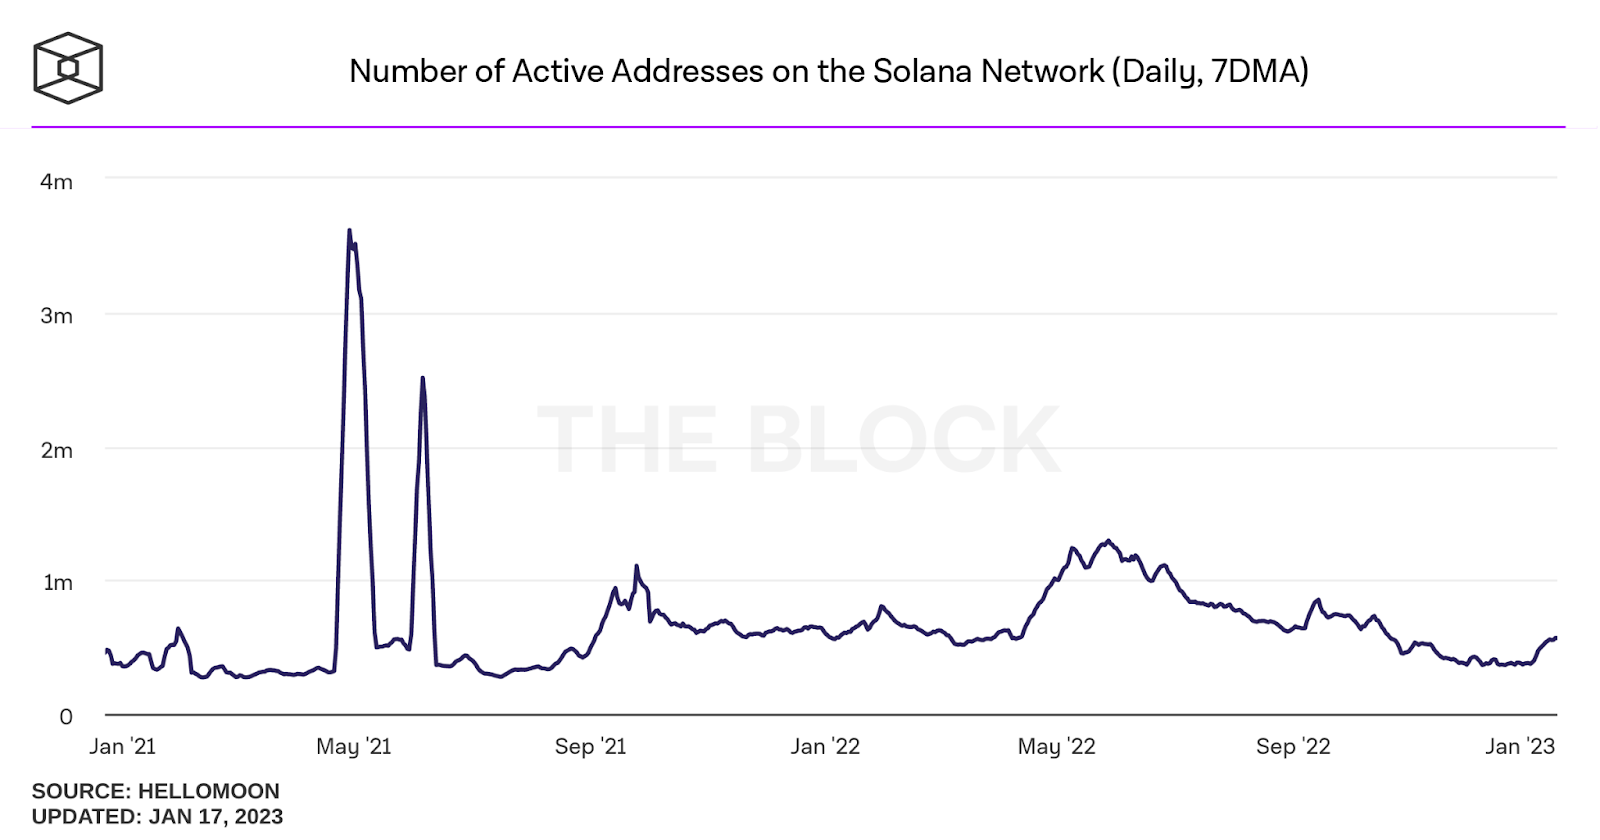
A 7-day average of active addresses on the Solana (SOL) network has jumped from 3,72,270 on Jan. 2 to 5,66,840 on Jan. 15 – an impressive increase of 52%. This remarkable growth indicates a strong start to the year for the Solana (SOL) ecosystem.
It’s also worth noting that active addresses have declined strongly since June 2022, and this trend has finally changed.
Number of new addresses
Block’s data further demonstrated an exponential increase in the number of new addresses on Solana over the past few weeks.
Following a prolonged period of decline, the number of new SOL addresses rose from 1,09,100 on Jan. 2 to 1,85,470 on Jan. 16, a jump of 70%.
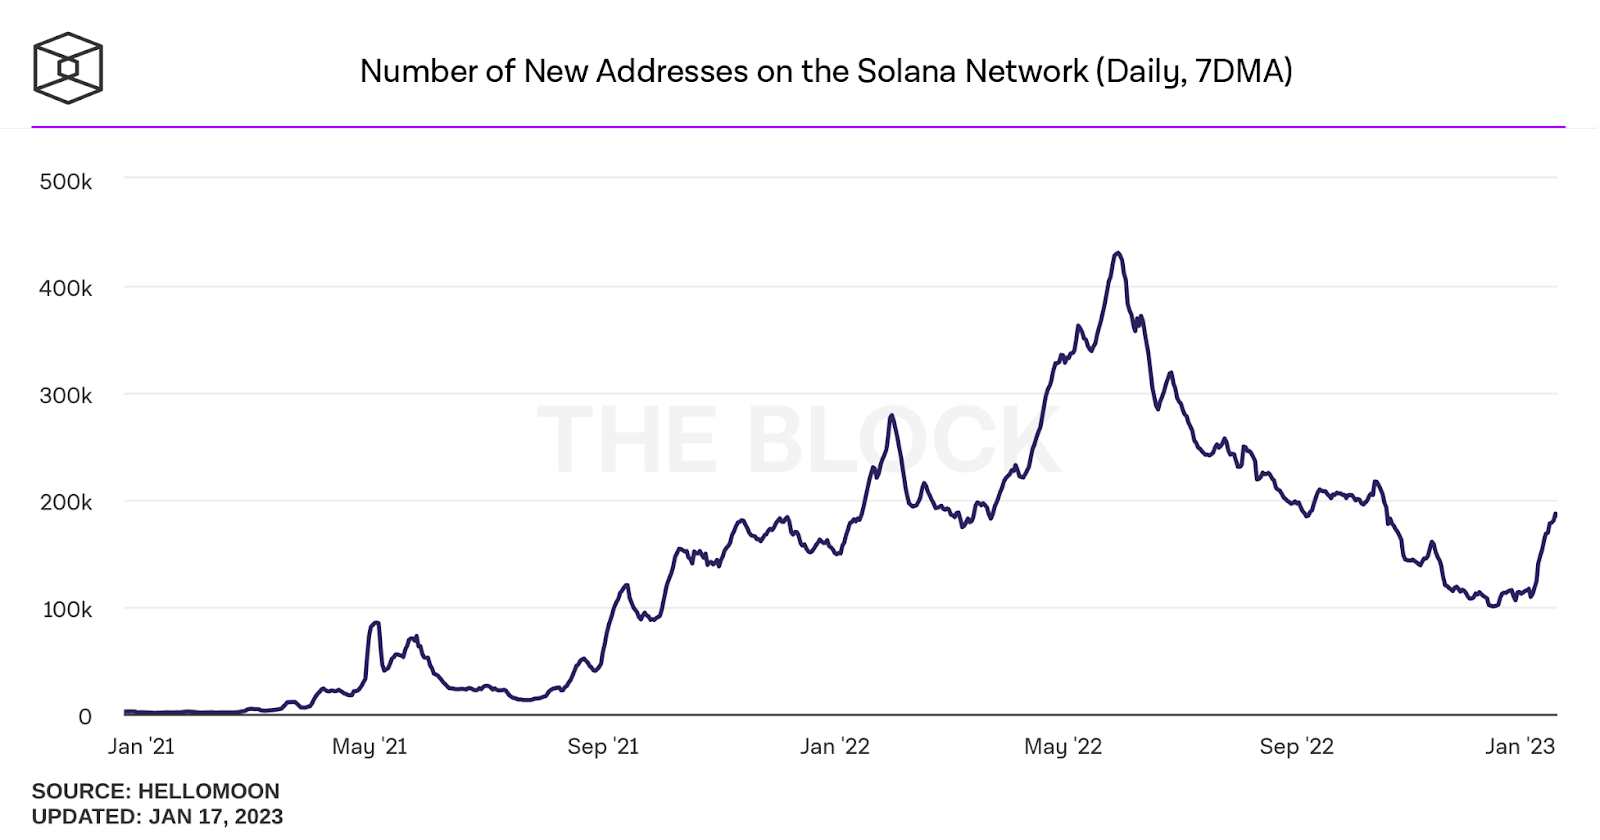
This surge in the onboarding of new users indicates an increase in activity on the platform, which could potentially positively impact the Solana price in the short term.
Solana technical analysis and price prediction
As of 18 January 2021, SOL was trading at $22.33 and is currently above its 10-day, 20-day, 50-day, and 100-day simple moving averages (SMA) and exponential moving averages (EMA) on the daily charts, indicating a possible reversal of the bearish trend.
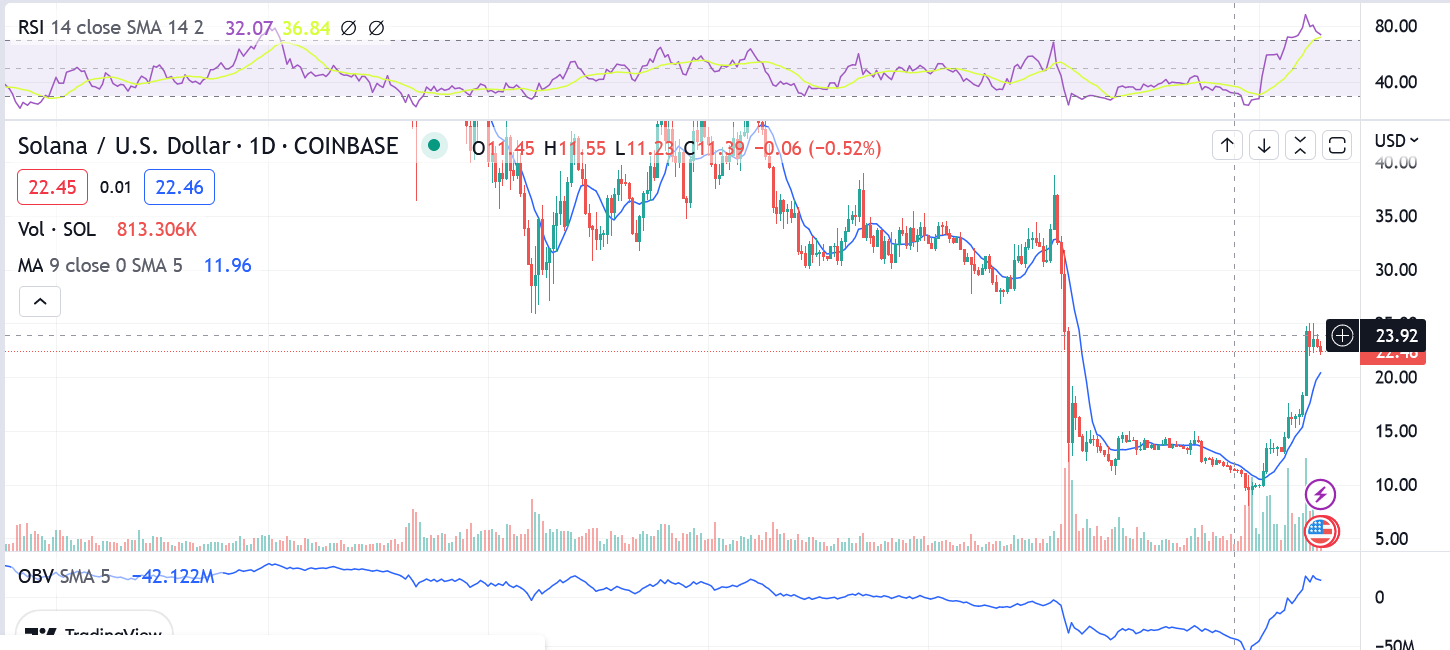
To confirm this trend shift, SOL must close above the 200-day SMA and EMA, which currently rest at $27.59 and $30.25, respectively. This closing would suggest a strong bullish momentum and may pave the way for further gains.
In addition, despite the relative strength index (RSI) entering the overbought zone at 73, the moving averages convergence divergence (MACD) is still far above its optimal levels. Therefore, it supports the possibility of a further rally.
Additionally, the on-balance volume (OBV) has spiked exponentially since the beginning of the January rally, reaching a level not seen since July-August 2022. A high OBV often precedes a breakout; however, other technical aspects should remain intact.
Meanwhile, Coincodex, based on technical analysis, predicts that SOL’s price will drop over the coming days, reaching $18.29 by 1 February, which would signify a 20% decrease from the current price levels.
The key price levels to watch on daily charts for Solana are the $22.60, $22.29 and $21.65 support levels and the $23.56, $24.20 and $24.51 resistance levels. A break from these levels could indicate higher volatility in the near future.
What’s next for Solana?
According to a recent report by Electric Capital, Solana has seen the most rapid growth in its developer ecosystem, reaching 2,000 total developers by 2022.
This milestone puts Solana second only to Ethereum (ETH) in terms of absolute numbers. However, it remains to be seen whether this growth can be sustained or if further rallies will follow.
Meanwhile, the significant price increase of Solana over the past two and a half weeks is impressive; however, potential investors should be cautious and ensure they have conducted thorough research and due diligence before investing.
Solana is a particularly volatile cryptocurrency and has not had a successful past year, so investors should be aware of the potential for pump-and-dump schemes.