Technical indicators suggest bitcoin on cusp of bull market

Bitcoin has been bullish since the beginning of the year, making it above the $30,000 barrier for the first time since June 2022. However, some analysts believe that the rally is not over yet and that there are still signs of strength in the market.
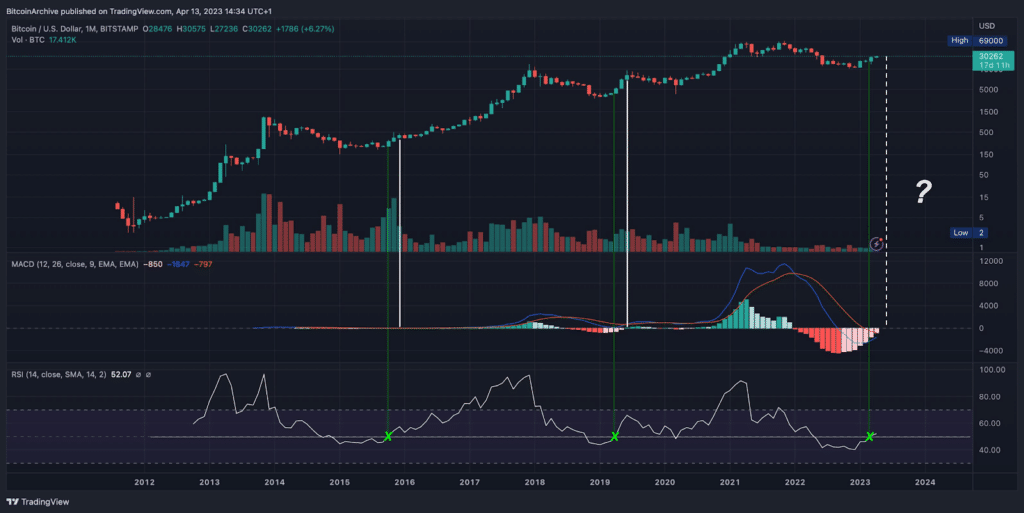
One is @BTC_Archive, a Twitter account that posts bitcoin-related news and charts. On April 13, the analyst suggested that BTC was headed towards a more sustained bull market judging by its historical behavior toward several technical indicators, including the monthly RSI and MACD.
RSI stands for relative strength index, a technical indicator that measures the momentum of price movements. It varies from 0 to 100, with values above 70 indicating excessive buying at high prices, and those below 30 indicating selling at prices below true value.
A monthly RSI above 50 means average gains are higher than average losses over a one-month period, indicating a positive trend.
On the other hand, MACD stands for moving average convergence divergence. It tracks the difference between two moving averages of prices. It consists of a MACD line, a signal line, and a histogram.
A monthly MACD crossover occurs when the MACD line crosses above the signal line, indicating a bullish momentum shift.
Analyst believes BTC in strong uptrend
According to @BTC_Archive, bitcoin has never made a new low after these two indicators showed bullish signals on the monthly chart.
The analyst posted a chart that shows the historical performance of bitcoin after each monthly RSI crossed above 50 and each monthly MACD crossed above zero.

The chart shows that bitcoin has continued to rise or consolidate after these events, never dropping below the previous low.
It implies that bitcoin is in a strong uptrend and that any pullbacks are likely to be temporary and followed by higher highs.
Of course, past performance does not guarantee future results, and many other factors affect the price of bitcoin. However, this analysis provides some confidence to the bulls, who expect bitcoin to reach new heights in 2023.
At the time of writing, BTC was up 2.14% in the last 24 hours and was trading at $30,856 per data from CoinMarketCap.
The top-ranked coin has a live market cap of $596.3 billion and a circulating supply of 19,345,925, against a maximum supply of 21 million.


