Visa vs. stablecoins: are they really competing?

Is Visa’s report on stablecoins an objective analysis, and who is behind the majority of transactions if not real users?
Stablecoins, crypto’s promise for stability and utility, are facing a stark challenge: their actual use. A recent study by Visa and Allium Labs has unveiled that over 90% of stablecoin transactions aren’t from genuine users.
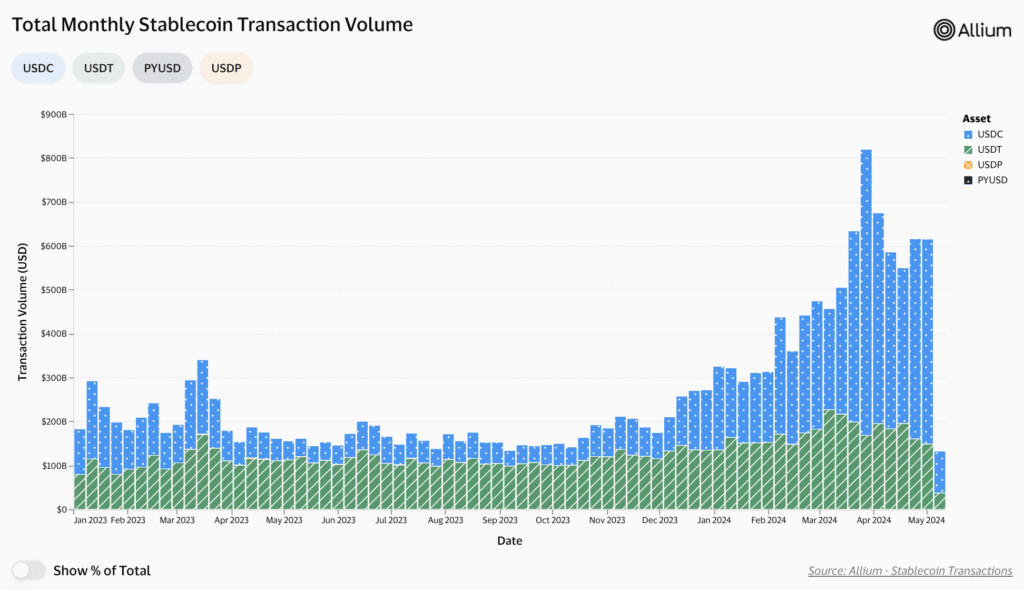
According to Cuy Sheffield, Head of Crypto at Visa, the total transactions involving stablecoins as of April 24 in the last 30 days amounted to a monumental $2.65 trillion.
However, only a fraction—$265 billion—were identified as originating from “organic payments activity,” highlighting a huge gap between reported and authentic usage.
Despite this discrepancy, the study noted a steady growth in the number of monthly active stablecoin users, indicating a persistent interest in these assets.
This begs the question: if the majority of transactions are not driven by real users, who is driving them, and what could it mean for the crypto market?
What really is happening?
Stablecoins are cryptocurrencies designed to maintain a stable value by pegging them to an underlying asset, typically a fiat currency like the U.S. dollar. This stability makes them attractive for various purposes, including trading, remittances, and everyday transactions.
Despite their utility, Visa’s dashboard reveals that less than 10% of stablecoin transaction volumes are considered to be from “organic payments activity.”
One major reason for this discrepancy is the prevalence of bots in the crypto space. These bots can execute transactions at high speeds and volumes, skewing the perception of real user adoption and usage patterns.
Meanwhile, the flexible nature of blockchain networks also contributes to this challenge. Blockchain allows for a wide range of use cases, including automated transactions. This flexibility can make it difficult to differentiate between transactions made by real users and those driven by automated processes.
Another factor contributing to the discrepancy in stablecoin transaction volumes is the double-counting of transactions.
For instance, converting $100 of stablecoin A to stablecoin B on any exchange would result in $200 of recorded stablecoin volume. This practice can inflate transaction volumes and create a misleading impression of the actual usage of stablecoins.
Visa and Allium Labs’ have used two filters to identify such activities.
The filters applied include a single-directional volume filter, which counts only the largest stablecoin amount transferred within a single transaction, eliminating redundant internal transactions from complex smart contract interactions.
Additionally, an inorganic user filter is applied, considering only transactions sent by accounts that have initiated less than 1000 stablecoin transactions and $10 million in transfer volume over the last 30 days.

Despite the difference in total transfer volume and bot-adjusted transfer volume, the analysis revealed a consistent increase in the number of monthly active stablecoin users. As of Apr. 24, across all chains, there were 27.5 million monthly active users, indicating a steady growth trend.
Analysis of USDC and USDT usage trends
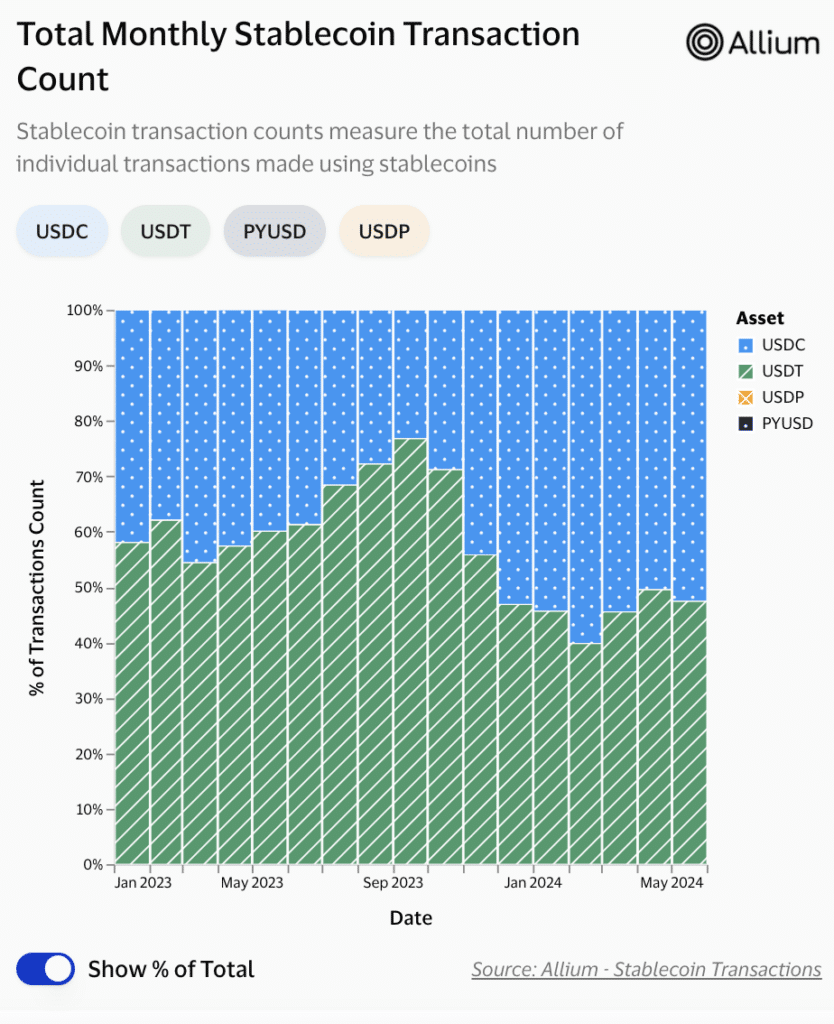
Visa’s analysis reveals striking growth in the usage of USD Coin (USDC) over the past eight months.
In September 2023, USDC accounted for 23% of all stablecoin transactions analyzed by Visa.

However, by the end of the year, this figure had more than doubled, exceeding 50% of all stablecoin transactions. Since December 2023, USDC has consistently accounted for a majority share of stablecoin transactions, reaching as high as 60% in February 2024.
This trend contrasts with the market capitalization of Tether (USDT) and USDC.
As of May 7, USDT boasts a market cap of approximately $111 billion, far higher than USDC’s market cap of just over $33 billion.
This discrepancy suggests that while USDT remains the dominant stablecoin in terms of market cap, USDC’s usage in actual transactions is outpacing USDT.
Pranav Sood, executive general manager for EMEA at payments platform Airwallex, commented that Visa’s findings indicate stablecoins are still in a nascent stage as a payment instrument. He suggested the need for improvement in existing payment systems to ensure their effectiveness.
However, not all experts agree with Visa’s analysis.
Nick van Eck, co-founder of Agora, a startup specializing in stablecoins, criticized Visa’s methodology. He argued that the data may include trading firms, which are legitimate businesses utilizing stablecoins, thus skewing the perception of actual user adoption.
Visa’s report and the rise of stablecoins
Visa’s recent report aligns with the growing prominence of stablecoins in facilitating cross-border payments.
According to Sacra, a market research firm, the volume of stablecoin transactions has surged from $26 billion in January 2020 to a staggering $1.4 trillion in April 2024 and could potentially surpass Visa’s total payments volume in the second quarter of 2024.
Sacra further reported that stablecoin transactions are processed within minutes, a stark contrast to the 6 to 9 hours required by traditional systems.
Cost-wise, stablecoin transactions are cheaper too, with fees as low as $0.0037, compared to the average $12 fee for traditional methods.
Meanwhile, major banks, including Wells Fargo, JPMorgan Chase, Visa, and Mastercard, are exploring the use of stablecoins to enhance their payment infrastructure.
What remains to be understood here is whether the reports by Visa are to state the facts or if it’s trying to undermine the competition.


