Bitcoin
Bitcoin (BTC)
$98,034.00 0.36735
Bitcoin price
Ethereum
Ethereum (ETH)
$3,630.20 0.36794
Ethereum price
BNB
BNB (BNB)
$706.34 -0.59744
BNB price
Solana
Solana (SOL)
$212.75 -0.6714
Solana price
XRP
XRP (XRP)
$2.37 -2.44405
XRP price
Shiba Inu
Shiba Inu (SHIB)
$0.0000238 -1.45329
Shiba Inu price
Pepe
Pepe (PEPE)
$0.0000206 -0.52153
Pepe price
Bonk
Bonk (BONK)
$0.0000343 -1.05183
Bonk price
dogwifhat
dogwifhat (WIF)
$2.10 -1.01816
dogwifhat price
Popcat
Popcat (POPCAT)
$0.861071 -1.2847
Popcat price

XRP price surges 15% in 24H as network growth drives rally, but will it last?
Follow-up
Markets
XRP price surges 15% in 24H as network growth drives rally, but will it last?

XRP’s price has surged over 15% in the last 24 hours and continues its rally but on-chain metrics show a gradual decline in bullish sentiment.

Data from Santiment reveals Ripple’s (XRP) active wallet addresses shot up over 116,000, helping XRP’s price rally by over 15% in 24 hours. The fourth-largest cryptocurrency’s market cap hit $155.69 billion, a record high on Dec. 3. The trading volume of the token is up by 93.29% in 24 hours. The massive rally that XRP has been witnessing in the post-U.S. elections era is due to a higher investor momentum reflecting more participation from retail investors than whales. 

Declining whale activity limits XRP rally

Whale activity, as shown by a decline in stablecoin holdings to 53.993% of the total supply, reflects cautious sentiment among large investors. This behavior is an indication that whales are chary of adding positions in the market, which is starting to limit the rally’s strength. 

Additionally, the Moving Average Convergence Divergence chart from TradingView, a key technical tool for analyzing the price movement, indicates a recent bearish crossover as the signal line crosses the MACD line. 
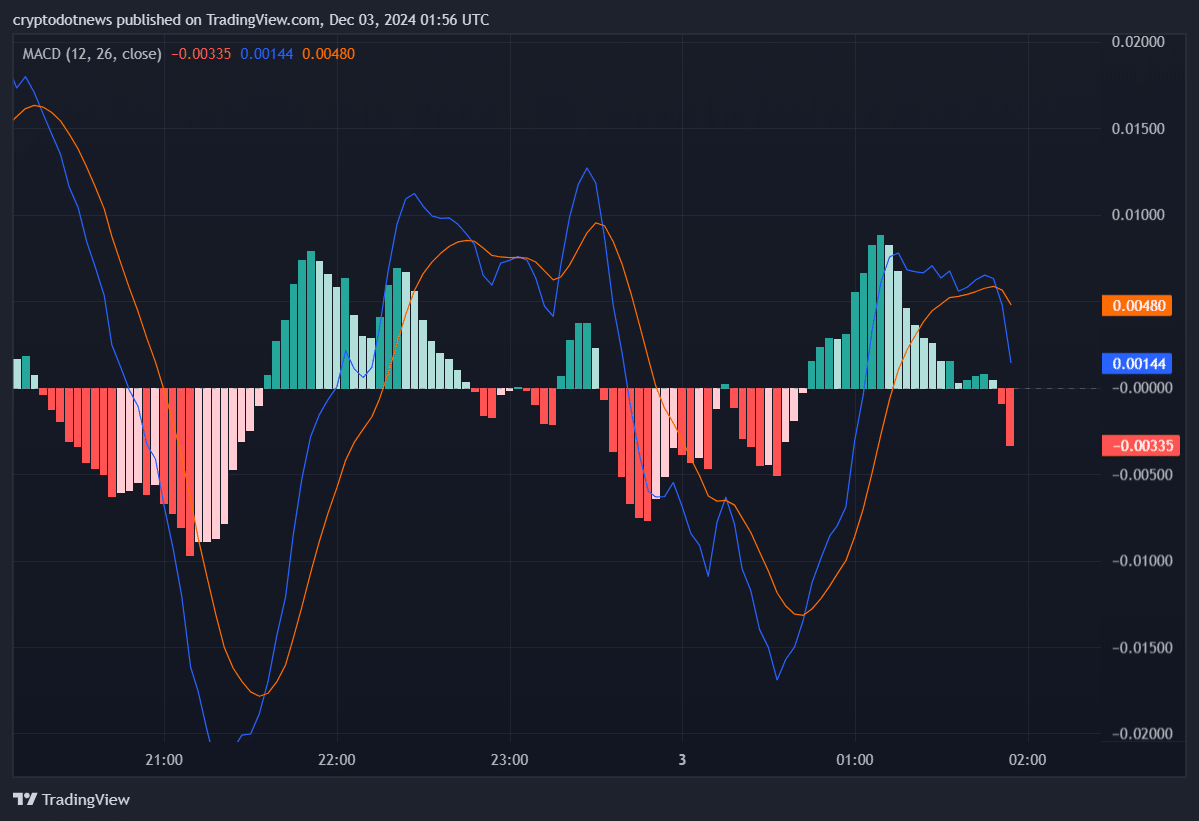
A MACD chart for XRP from TradingView on December 3, 2024, showing a bearish crossover where the signal line crosses the MACD line. The histogram indicates declining momentum with negative values.
XRP MACD analysis reveals a bearish crossover, signaling declining bullish momentum and potential short-term price correction. | Source: TradingView chart by crypto.news

In the short term, the price for the Ripple-token seems to aim for lower bounds. The histograms have shifted downward into negative territory, further reflecting a cautious stance for XRP in the market. 

The profit-to-loss metric reflects a cautious sentiment
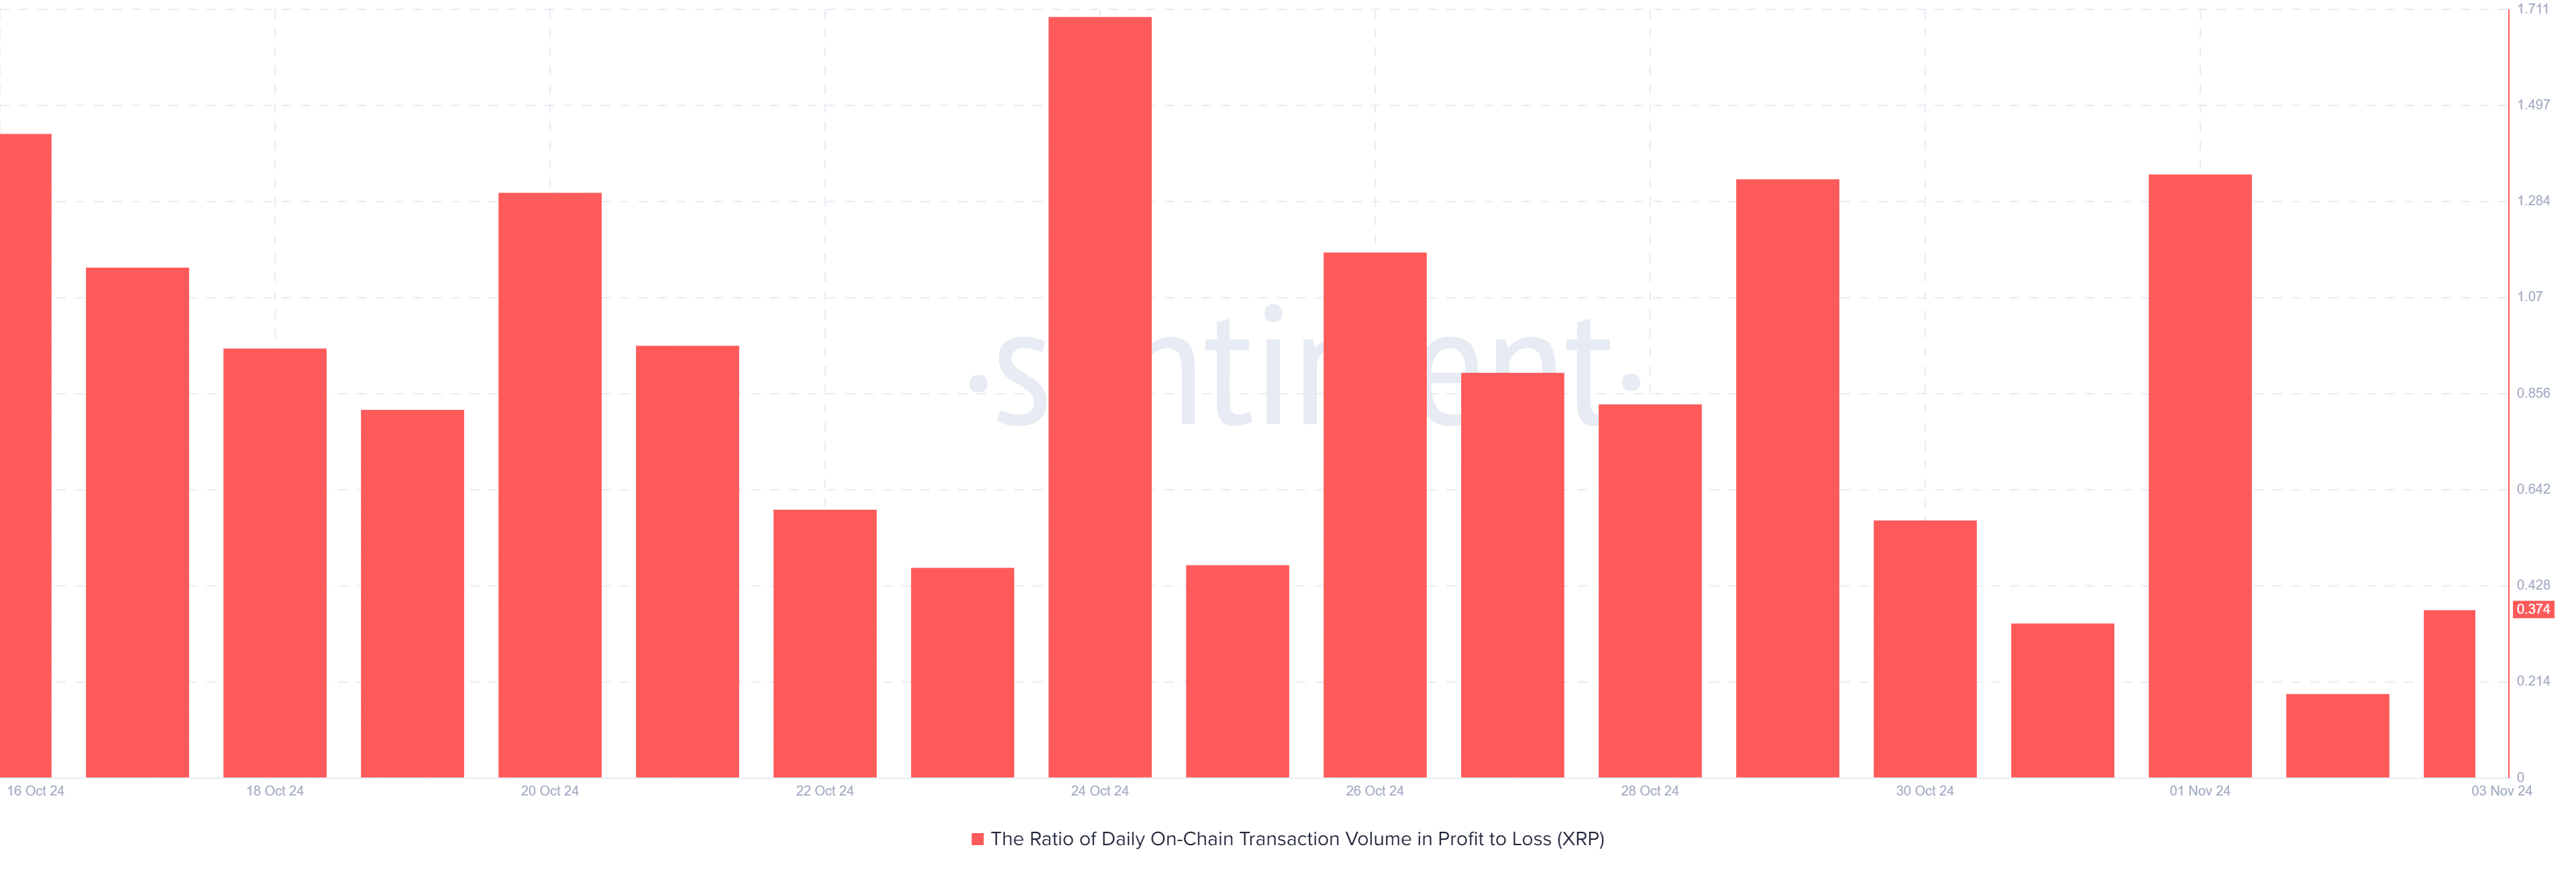
A bar chart showing the daily ratio of on-chain transaction volume in profit-to-loss for XRP from October 16 to November 3, 2024. The chart highlights fluctuations in the metric, with notable peaks and valleys reflecting changing market sentiment.
XRP’s daily profit-to-loss ratio shows fluctuating investor sentiment, with a recent low of 0.374 indicating cautious trading behavior. | Source: Santiment by crypto.news

The on-chain profit-to-loss metric further shows that traders are not keen on taking aggressive positions with the current market rally. The daily profit-to-loss ratio recently hovered around 0.374, meaning more investors are selling than buying the token. A low number for daily profit-to-loss during a rally indicates hesitation for traders to enter into long positions. This reading, coupled with the bearish MACD crossover, implies that further XRP price upticks might be hard for the token to make. 

Challenges to sustain XRP’s positive rally

At press time, XRP is trying to break out from its downward rally in the last hour. The divide between retail-driven network growth and the cautious outlook observed by institutional investors is making it harder for the token to continue its upward movement, even as WisdomTree has filed for a spot XRP ETF. If institutional buyers can expect a positive development for XRP from the regulatory body, they may increase liquidity in the market, which can push XRP prices higher. 

Ripple tweets on staying alert against scams amid uptick in the crypto market for XRP token

While in the short-term, the market sentiment is cautious, an increase in XRP’s price and sustaining any positive rally will depend on whether the token can overcome the challenges reflected in the on-chain metrics. 

Disclosure: This article does not represent investment advice. The content and materials featured on this page are for educational purposes only.