Zcash price enters discovery with $2,000 in sight


Zcash price traded near $1,455 on Sep. 18 after retreating from an intraday high of $1,535, while technical indicators and liquidation data pointed to continued volatility around the $1,500 level.
- Zcash price fell about 5.2% from its $1,535 intraday high to trade near $1,455.
- The 4-hour RSI remained bullish at 68.35 but moved below its signal average.
- Liquidation data showed major liquidity near $1,420 and between $1,540 and $1,550.
- Analysts said ZEC was entering price discovery but warned that a 10%–15% correction remained possible.
Zcash price action today
Zcash (ZEC) price rose as high as $1,535.82 before sellers pushed the token back below $1,500, according to the daily chart. ZEC traded at approximately $1,455 at the time of writing, down 0.78% during the current daily session.
The pullback came after an accelerated advance from the $1,100 area. ZEC broke above $1,250 and $1,375 with limited consolidation before testing the $1,500 Murrey Math resistance level.
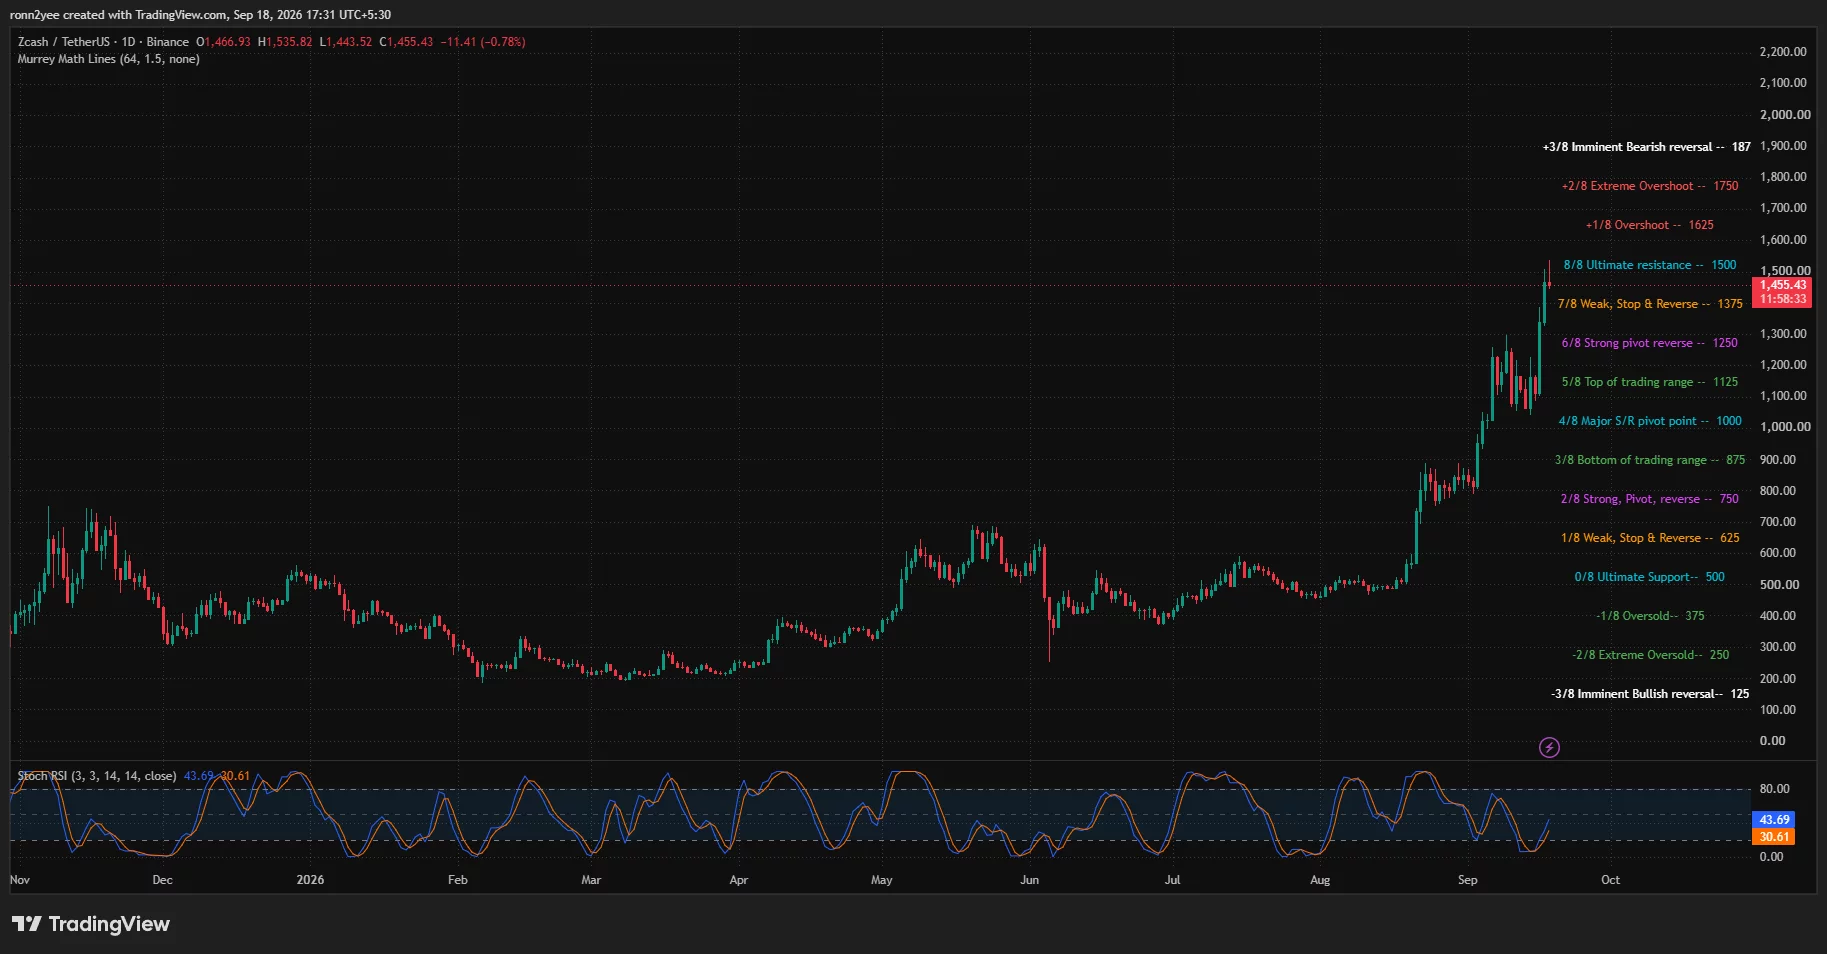
Price has gained more than 190% since trading near $500 in August. ZEC has also established a sequence of higher highs and higher lows across the daily and 4-hour charts, keeping its wider uptrend intact despite the latest retreat.
The daily Stochastic RSI started recovering from lower levels, with the faster line at 43.69 and the signal line at 30.61. The crossover showed that daily momentum was rebuilding after the indicator cooled during an earlier consolidation.
However, the rejection above $1,500 showed that sellers remained active near the psychological level. ZEC would need a confirmed daily close above that zone to reduce the risk of a deeper pullback.
What is driving the ZEC rally?
The rally followed the Zcash community’s vote on proposals tied to the Network Upgrade 7 roadmap. Nearly 99.9% of participating ZEC reportedly backed reducing the network’s target block time from 75 seconds to 25 seconds, while 98.9% supported keeping its current halving schedule.
The proposed change would shorten transaction confirmation times without increasing daily issuance because the block reward would be adjusted for the faster schedule.
Paradigm co-founder Matt Huang also disclosed the venture firm’s exposure to Zcash in a Sep. 16 post. Huang discussed the network’s development funding and said Paradigm considered the fund important to Zcash’s future.
The disclosure added an institutional element to a rally already supported by the governance vote and renewed interest in privacy-focused cryptocurrencies.
US investors can also access regulated ZEC exposure through Grayscale’s Zcash ETF, which trades on NYSE Arca under the ticker ZCSH. The product gives brokerage customers exposure without requiring them to hold ZEC directly, though its market price can differ from the value of its underlying assets.
Zcash technical indicators remain bullish
The 4-hour chart showed that ZEC’s momentum remained positive even as the token retreated from its latest high.
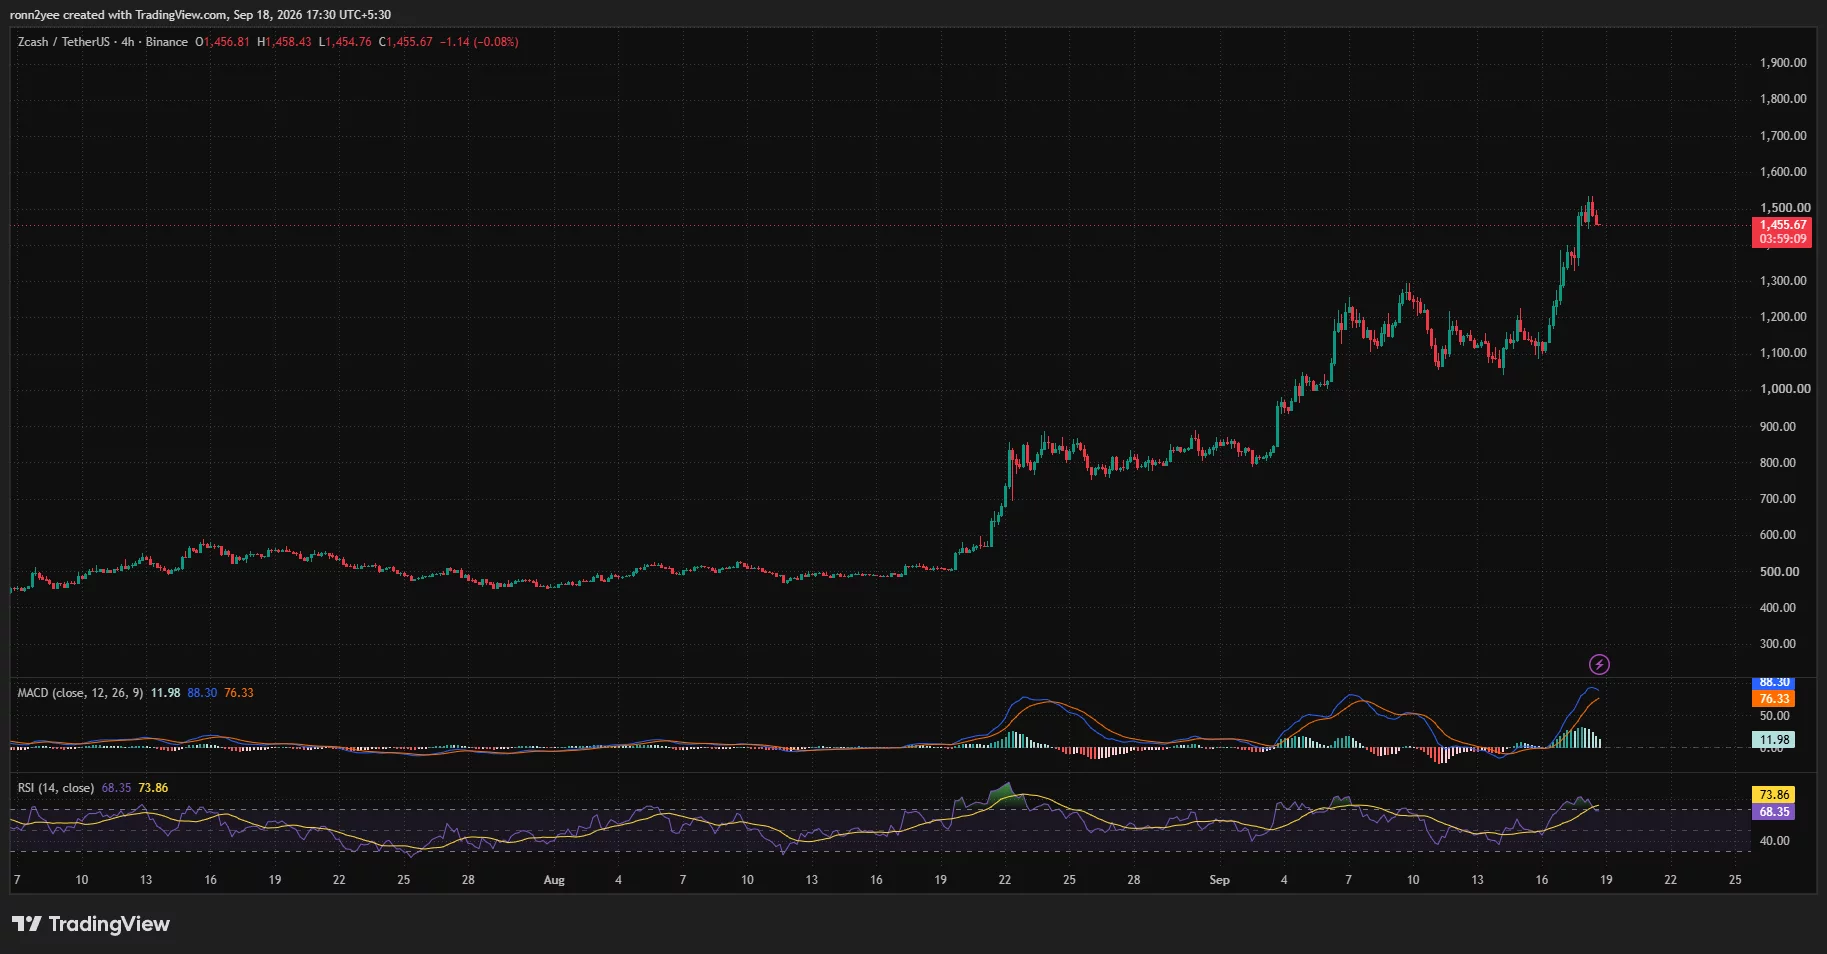
The moving average convergence divergence indicator stood at 88.30, above its signal line at 76.33. Its positive histogram reading of 11.98 indicated that buyers still controlled the broader momentum trend.
However, the histogram had begun to contract. A continued decline would show that the speed of the rally was slowing, increasing the possibility of consolidation or a short-term correction.
The 4-hour relative strength index stood at 68.35, just below overbought territory. The RSI had also fallen below its moving average at 73.86, showing that short-term buying pressure had eased after the move above $1,500.
ZEC’s immediate resistance sits between $1,500 and the intraday high of $1,535. A 4-hour close above $1,535 could open a move toward the next Murrey Math targets at $1,625 and $1,750.
The first important support lies near $1,420, followed by the former breakout level at $1,375. A close below $1,375 could expose $1,250, which previously acted as a major reversal level.
Liquidation clusters frame the next move
The 24-hour liquidation heatmap showed a dense concentration of leveraged positions around $1,420. The band was the strongest nearby liquidity pool below the market and could attract price if the current pullback continues.
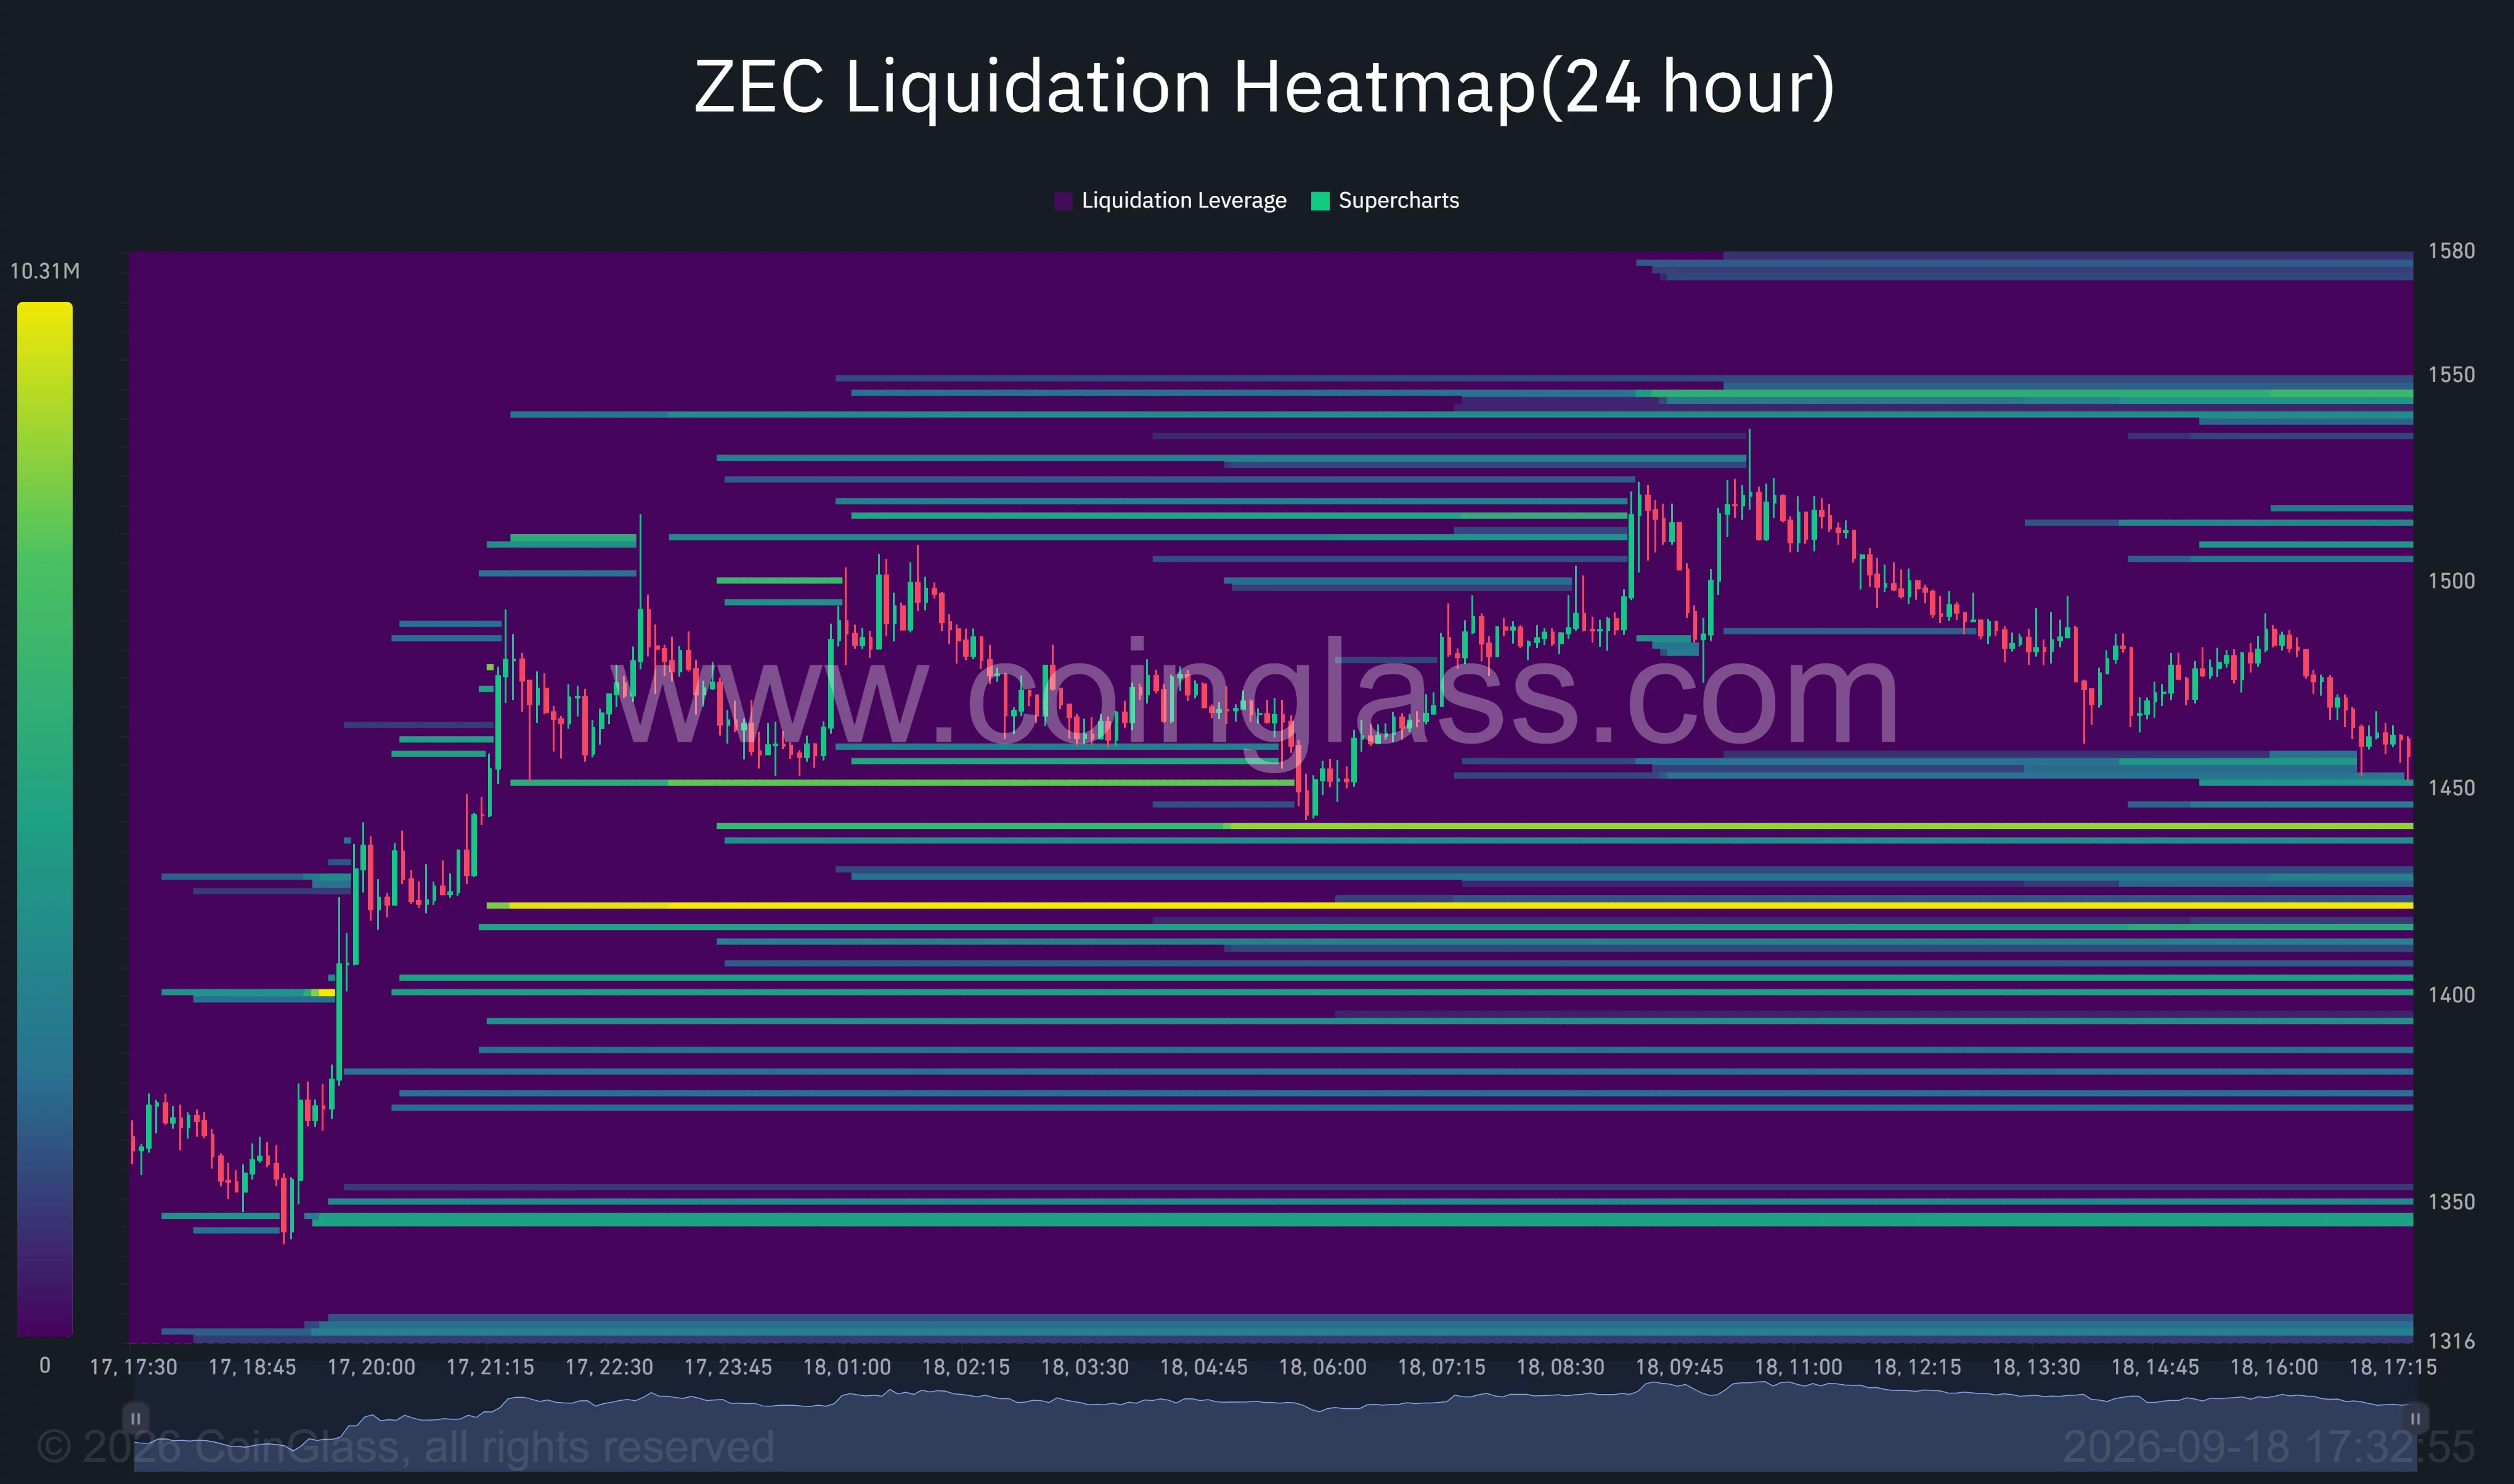
Additional liquidity appeared between $1,440 and $1,460, placing ZEC near an area where forced closures could increase short-term price swings.
Above the market, the largest nearby concentration sat around $1,540 to $1,550. A recovery above $1,500 could push ZEC toward that zone as short positions become vulnerable.
A larger but more distant liquidity area was visible around $1,580. On the downside, notable clusters appeared near $1,400, $1,375 and $1,345.
The distribution leaves ZEC between sizable liquidity pools on both sides. A break below $1,440 would favor a test of $1,420, while reclaiming $1,500 could bring the $1,540–$1,550 area back into focus.
What analysts are saying
Pseudonymous trader Altcoin Sherpa described ZEC as the strongest asset in the market but said the rally could still experience a sharp correction.
“Would like to see some chop and then another leg up to 2K,” the analyst wrote, adding that a 10%–15% decline could offer another entry if the wider trend remained intact.
A correction of that size from $1,500 would place ZEC between approximately $1,275 and $1,350. The range overlaps the $1,250 Murrey Math support and the previous breakout area near $1,375.
Another pseudonymous analyst, Scient, said ZEC was “practically into price discovery” after moving beyond its previous chart resistance. The analyst identified the former highs near $800 as a potential long-term support area if ZEC experiences a much larger correction later in the cycle.
For the shorter-term setup, $1,420 remains the level separating a limited pullback from a possible test of $1,375. Bulls must reclaim $1,500 and clear $1,535 to restore momentum toward $1,625.
Disclosure: This article does not represent investment advice. The content and materials featured on this page are for educational purposes only.