Bitcoin miners enter $8.2b selling spree: $60k price rally at risk?


Bitcoin’s price tumbled to a weekly low of $50,664 on Feb. 21, narrowly avoiding massive liquidations; on-chain data analysis pinpoints the likely causes of the recent pullbacks.
After a remarkable 27% February uptick that saw Bitcoin (BTC) hit a 3-year peak of $52,985 on Feb. 20, Bitcoin is struggling to maintain momentum.
With miners ramping up profit-taking ahead of the upcoming halving event, a decline in ETF inflows threatens to scuttle the BTC price rally.
Bitcoin miners sold BTC worth $8.2 billion in previous 30 days
Bitcoin price dipped $50,664 on Feb. 21, sparking concerns of widespread liquidations as the bears looked to break below $50,000 for the first time since the Valentine’s Day rally. Market data shows the Bitcoin miners’ selling trend, and a slight blip in ETF inflows this week contributed to the pullback.
Bulls have managed to stage an instant rebound toward $51,500 at press time on Feb. 22, but a closer look at the on-chain data trail suggests the bull rally is not yet back on track.
Cryptoquant’s miner reserves metric monitors real-time balances held by BTC miners. It shows that BTC validators hold a cumulative balance of 1,824,201 BTC as of Feb. 22, a 160,000 BTC decline from the balances held on Jan. 31.
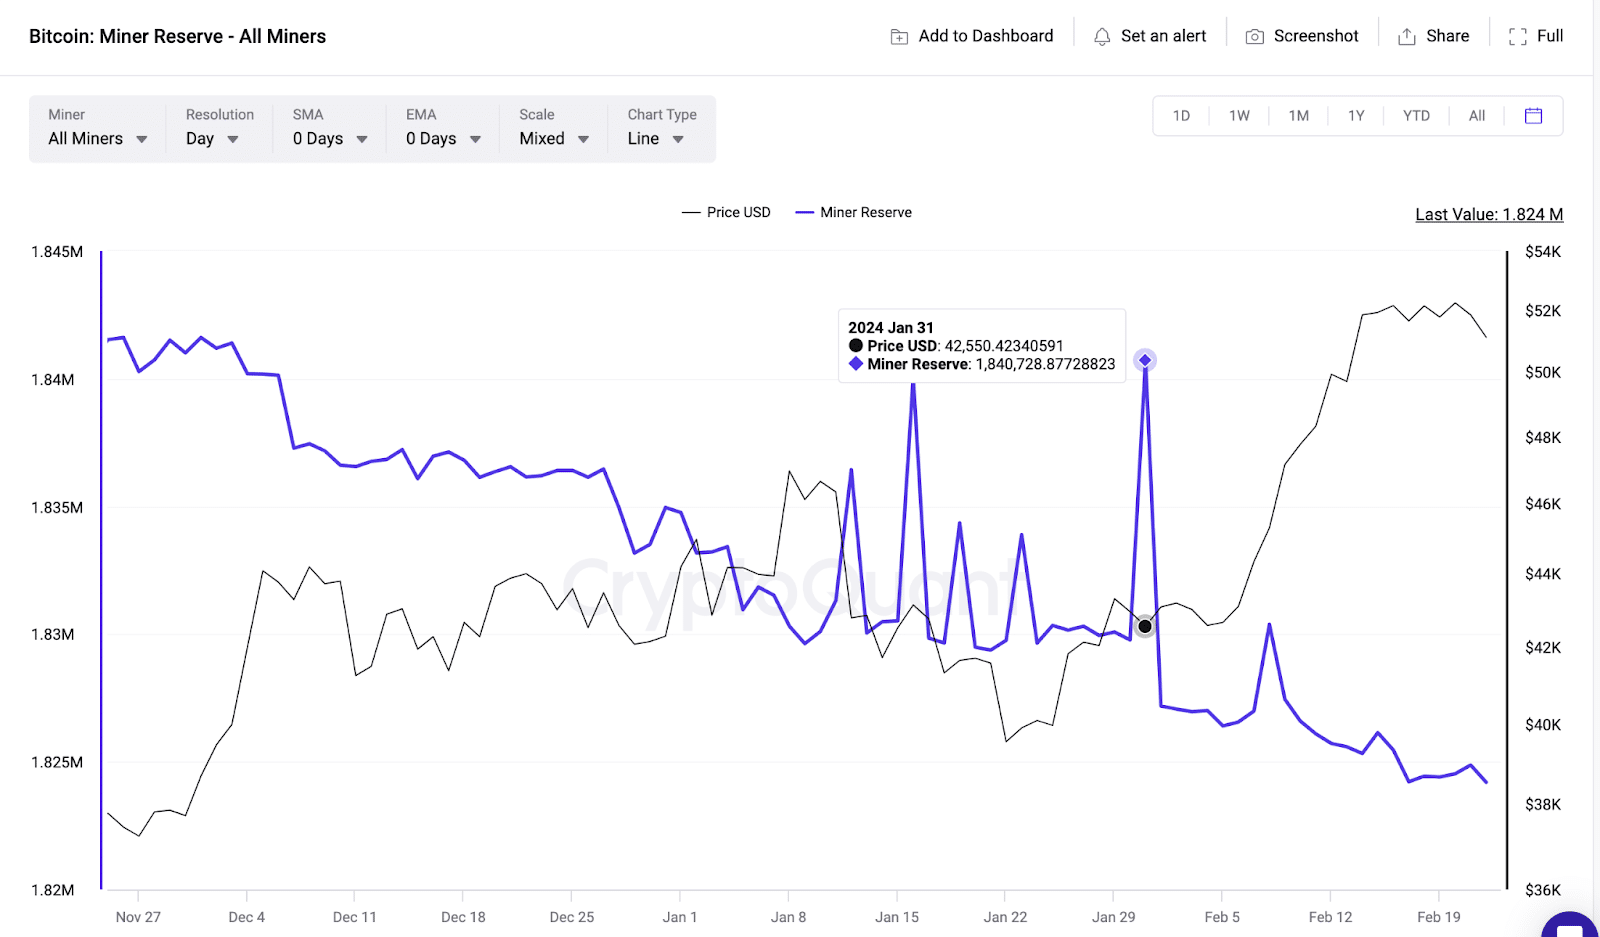
Valued at about $51,500 per coin, the recently-traded 160,000 BTC are worth approximately $8.2 billion. Notably, the chart illustrates how the miners had intensified the selling frenzy by $102 million after BTC’s price hit a local peak of $52,858 on Feb. 15.
Typically, a sell-off among miners indicates a bearish sentiment among a significant bloc of stakeholders. With approximately 10% of the total circulation supply in their custody, the BTC miners significantly influence Bitcoin price action.
Without a commensurate demand surge, it is unsurprising that the latest wave of miners’ sell-off has coincided with Bitcoin prices tumbling to a weekly low.
Bitcoin ETFs have not kept up last week’s demand
The BTC price rally in the first half of February was attributed to the Bitcoin ETF making record-breaking inflows.
Ahead of the ETF’s weekly trading opening on Feb. 19, BTC hit a new 2024 peak in the early GMT hours as strategic investors looked to front-run potential gains if the ETFs pick up the buying trend from where they left off in the previous week. But that has not happened.
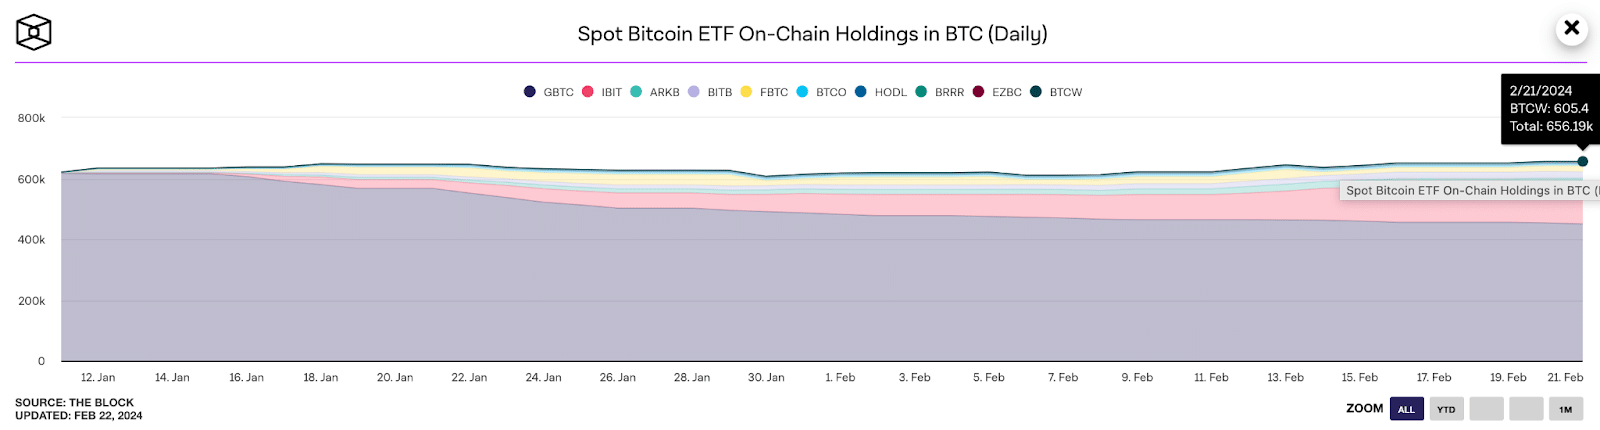
For context, TheBlock’s ETF on-chain flow chart above shows historical changes in BTC balances held by Bitcoin ETF.
Unlike last week’s 17,480 BTC accumulation, Bitcoin ETFs have slowed the buying trend by 73%, acquiring only 4,680 BTC between Feb. 19 and Feb. 22.
In summary, there has been a decline in ETF demand this week, while miners are intensifying their selling spree ahead of the halving.
The two critical factors have been pivotal to BTC price tumbling towards $50,000 rather than breakout towards a new all-time high above $60,000 as the bulls anticipated, with the rapid accumulation ahead of the ETF trading hours on Feb. 19.
Price forecast: Bitcoin can hold above $48,500
Amid dwindling ETF demand and miner’s mounting selling frenzy, BTC price looks likely to hold above $48,500 if it loses the $50,000 psychological support level in the short term.
The Bollinger Band technical indicator further underscores this outlook by providing insights into potential support and resistance levels for Bitcoin’s short-term price movement.
With the 20-day Simple Moving Average (SMA) price currently at $48,560, it is a crucial support level below the $50,000 threshold.
This suggests that if the price were to drop below $50,000, the $48,560 level may act as a significant area of support, potentially halting further downward momentum.
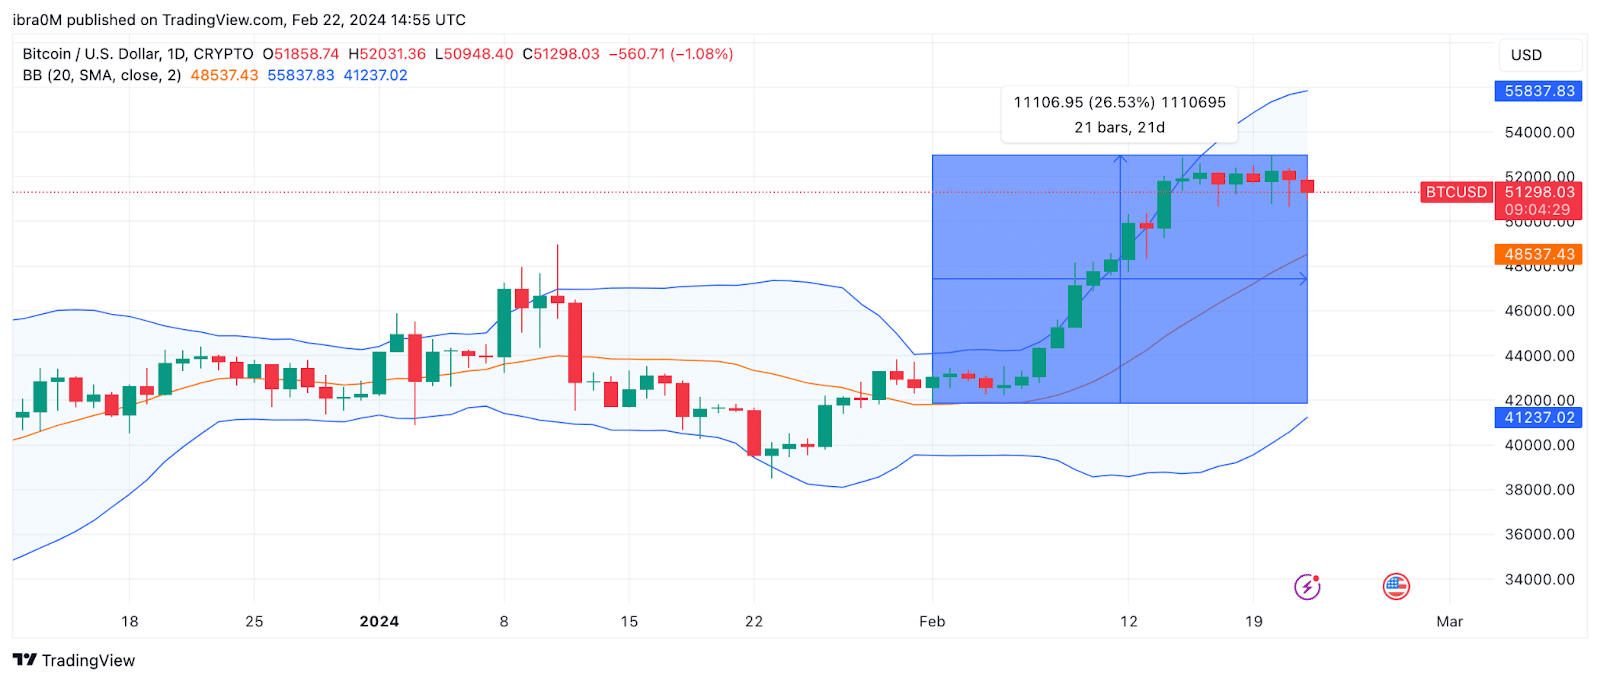
If bullish momentum prevails and Bitcoin reclaims the $53,000 level, the upper Bollinger band indicates that the bears may emerge again, establishing a sell-wall at around $55,830.
This signifies a key resistance level that could impede upward movement, potentially leading to a consolidation phase or a pullback.
Given these technical dynamics, strategic swing traders may consider setting short-term stop-loss orders around the $45,000 area to manage risk in case of a breakdown below the $48,560 support level.
Conversely, bullish traders may target take-profit orders around the $55,000 mark, anticipating potential resistance near $55,830 and aiming to capitalize on any further upward movement.