Bitcoin price reclaims $63,000: Can the recovery reach $64K?


Bitcoin price recovered above $62,000 on Monday after last week’s selloff pushed the asset to about $59,100.
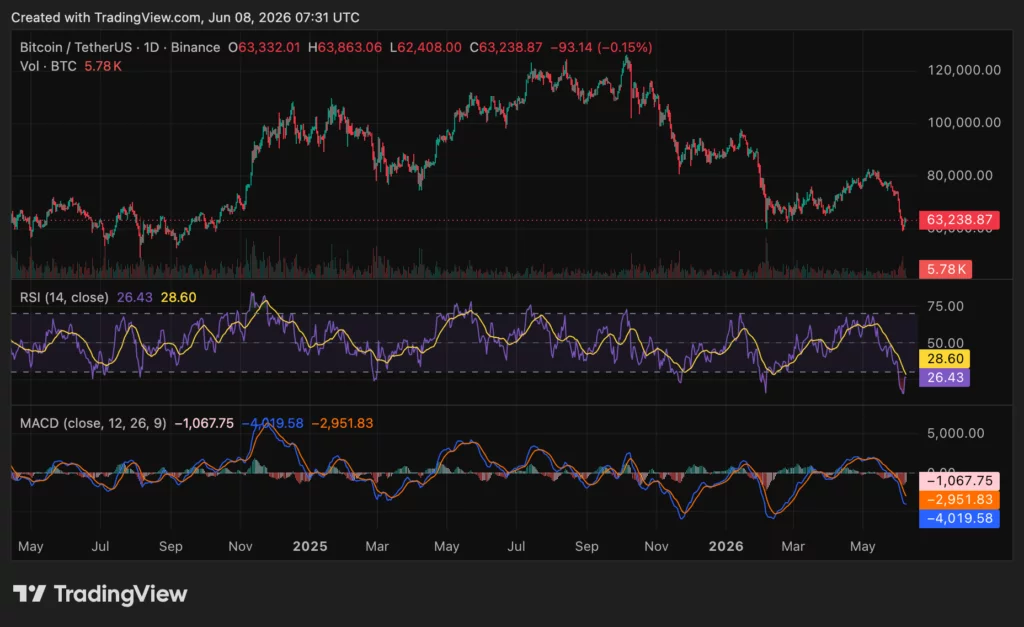
- Bitcoin reclaimed its 200-week average after sweeping February’s low, but resistance remains near $64,000.
- Oversold RSI supports a relief bounce, while bearish MACD shows sellers still control broader momentum.
- Rising open interest increases liquidation risk as traders watch $55,000 if the recovery loses support.
The rebound briefly carried BTC near $64,200 before sellers returned, leaving the market between long-term support and its first recovery barrier.
At the time of writing, Bitcoin traded near $63,000, up 1.39% over 24 hours. Its daily range stood between $61,206 and $63,739, while the seven-day loss remained 14.06%. Buyers have slowed the decline, but they have not reversed the broader weekly trend. ETF flows and futures positioning also remain important tests for the rebound.
Bitcoin price holds the 200-week moving average
Bitcoin closed the week above its 200-week simple moving average near $62,800 after sweeping the February low, according to crypto analyst Crypto Rover. Traders follow this average because it tracks Bitcoin’s long-term trend.
Holding above it could support another test of $64,000 to $64,200. A daily close below the average would return attention to $60,000 and the recent $59,100 low.
The June decline followed several waves of macro pressure. Higher inflation weakened expectations for easier monetary policy in May. Strong U.S. employment data then added another setback.
The economy created 172,000 jobs in May, compared with forecasts of 85,000, while unemployment stayed at 4.3%. As previously reported by crypto.news, Bitcoin’s break below $60,000 came as total crypto liquidations passed $1.7 billion within 24 hours.
Oversold RSI meets a still-bearish MACD setup
Bitcoin’s 14-day relative strength index stands at 26.43, below the 30 oversold threshold and its RSI moving average of 28.60. The reading shows that selling became stretched, which can support a relief bounce without confirming a lasting bottom. According to analyst Crypto Rover, the Fear and Greed Index has also fallen to 8, placing sentiment in “extreme fear.”
The Wolf of All Streets trader Scott Melker said Bitcoin may be forming a weekly bullish divergence from oversold RSI. “Need this week to close with a clear elbow up on price and RSI,” he wrote. The signal remains unconfirmed because price and momentum must turn higher together.
Bitcoin’s MACD line sits near -4,019.58, below the signal line at -2,951.83, while the histogram remains negative at -1,067.75. Rising selling volume supports the bearish momentum reading and shows that sellers remain active despite the rebound.
Trump-Iran headlines keep Bitcoin traders cautious
Bitcoin’s move toward $64,000 followed comments from U.S. President Donald Trump about a possible agreement with Iran. Trump said the parties were “very close” to a deal and claimed Israeli Prime Minister Benjamin Netanyahu did not control the process, according to Reuters. Traders initially treated the remarks as a possible reduction in geopolitical risk, helping stocks and cryptocurrencies recover from their late-week lows.
Events on June 8 weakened that optimism. Israel struck military targets and a petrochemical site in Iran after Tehran fired missiles toward Israel. Trump maintained that the attacks would not derail talks, but the renewed exchange left the agreement uncertain.
Brent oil rose above $96 per barrel as prices gained more than 3%. Higher energy costs could keep inflation and interest-rate concerns active for Bitcoin. The market may therefore remain sensitive to each new military or diplomatic update.
Bitcoin support levels place $55,000 next in focus
Analyst Ali Martinez listed the 200-week average at $62,800, the 300-week average at $55,000 and the 400-week average near $42,500. These levels form a long-term support ladder rather than fixed targets.
Bitcoin must first defend $62,800 and $60,000 before the lower averages become active tests. The $55,000 area also matches a long-running trendline tracked by Crypto Patel, making it the next broad support zone if the recent low fails.
Calls for $42,500 or $35,000 remain conditional bearish cases rather than immediate forecasts. Bitcoin would need to lose the 200-week average, the $60,000 level, the $59,100 low and the $55,000 region before those levels gain weight. That sequence gives traders several areas to assess before treating a deeper fall as the main path.
Derivatives data adds another risk. Crypto.news reported that open interest rose while Bitcoin’s price fell, showing that traders added leverage during weakness. That setup can produce a short squeeze if BTC clears $64,200, or another long squeeze if the price falls below $60,000. A firm close above $64,200 would strengthen the recovery and support the bullish RSI case.
For now, $62,800 remains the main dividing line. Holding it would keep $64,200 within reach and give buyers time to build a base. Failure to hold the 200-week average would place $60,000, $59,100 and $55,000 back in focus, while the bearish MACD would remain the stronger trend signal.
Disclosure: This article does not represent investment advice. The content and materials featured on this page are for educational purposes only.