


Bitcoin price reclaims $64K as volatility trap hits 91


Bitcoin price rose nearly 2% to reclaim $64,000 on Aug. 17, but weak daily momentum and unusually compressed volatility leave the next major move uncertain.
- Bitcoin price rebounded from $62,751 to an intraday high of $64,227.
- Glassnode’s volatility trap score reached 91, its highest level in more than 3.5 years.
- BTSE’s Jeff Mei said ETF flows and Federal Reserve signals remain key to a sustained recovery.
- Liquidation clusters near $64,700 and $62,200 could shape Bitcoin’s next move.
Bitcoin price returns above $64,000
According to data from crypto.news, Bitcoin (BTC) price traded near $64,154 at press time after gaining about 2% during the daily session. The recovery followed an intraday low of $62,751 and carried BTC above the 78.6% Fibonacci retracement level at $63,152.
The rebound also erased part of the decline recorded over the previous week, when Bitcoin repeatedly tested support between $62,500 and $63,000. Buyers defended that area again on Aug. 17, helping the price reach a session high of $64,227.
Jeff Mei, chief operating officer at crypto exchange BTSE, told crypto.news that recent exchange-traded fund flows contributed to the earlier weakness in Bitcoin and Ethereum.
“BTC and ETH pulled back a bit after some ETF outflows last week, with Bitcoin now sitting around $63,000 and ETH near $1,878.”
The 4-hour chart shows that short-term buying pressure strengthened during the latest recovery. BTC moved above the Bollinger Bands’ middle line at $63,173 and crossed the upper band near $63,774, showing that the rebound accelerated beyond its recent trading range.
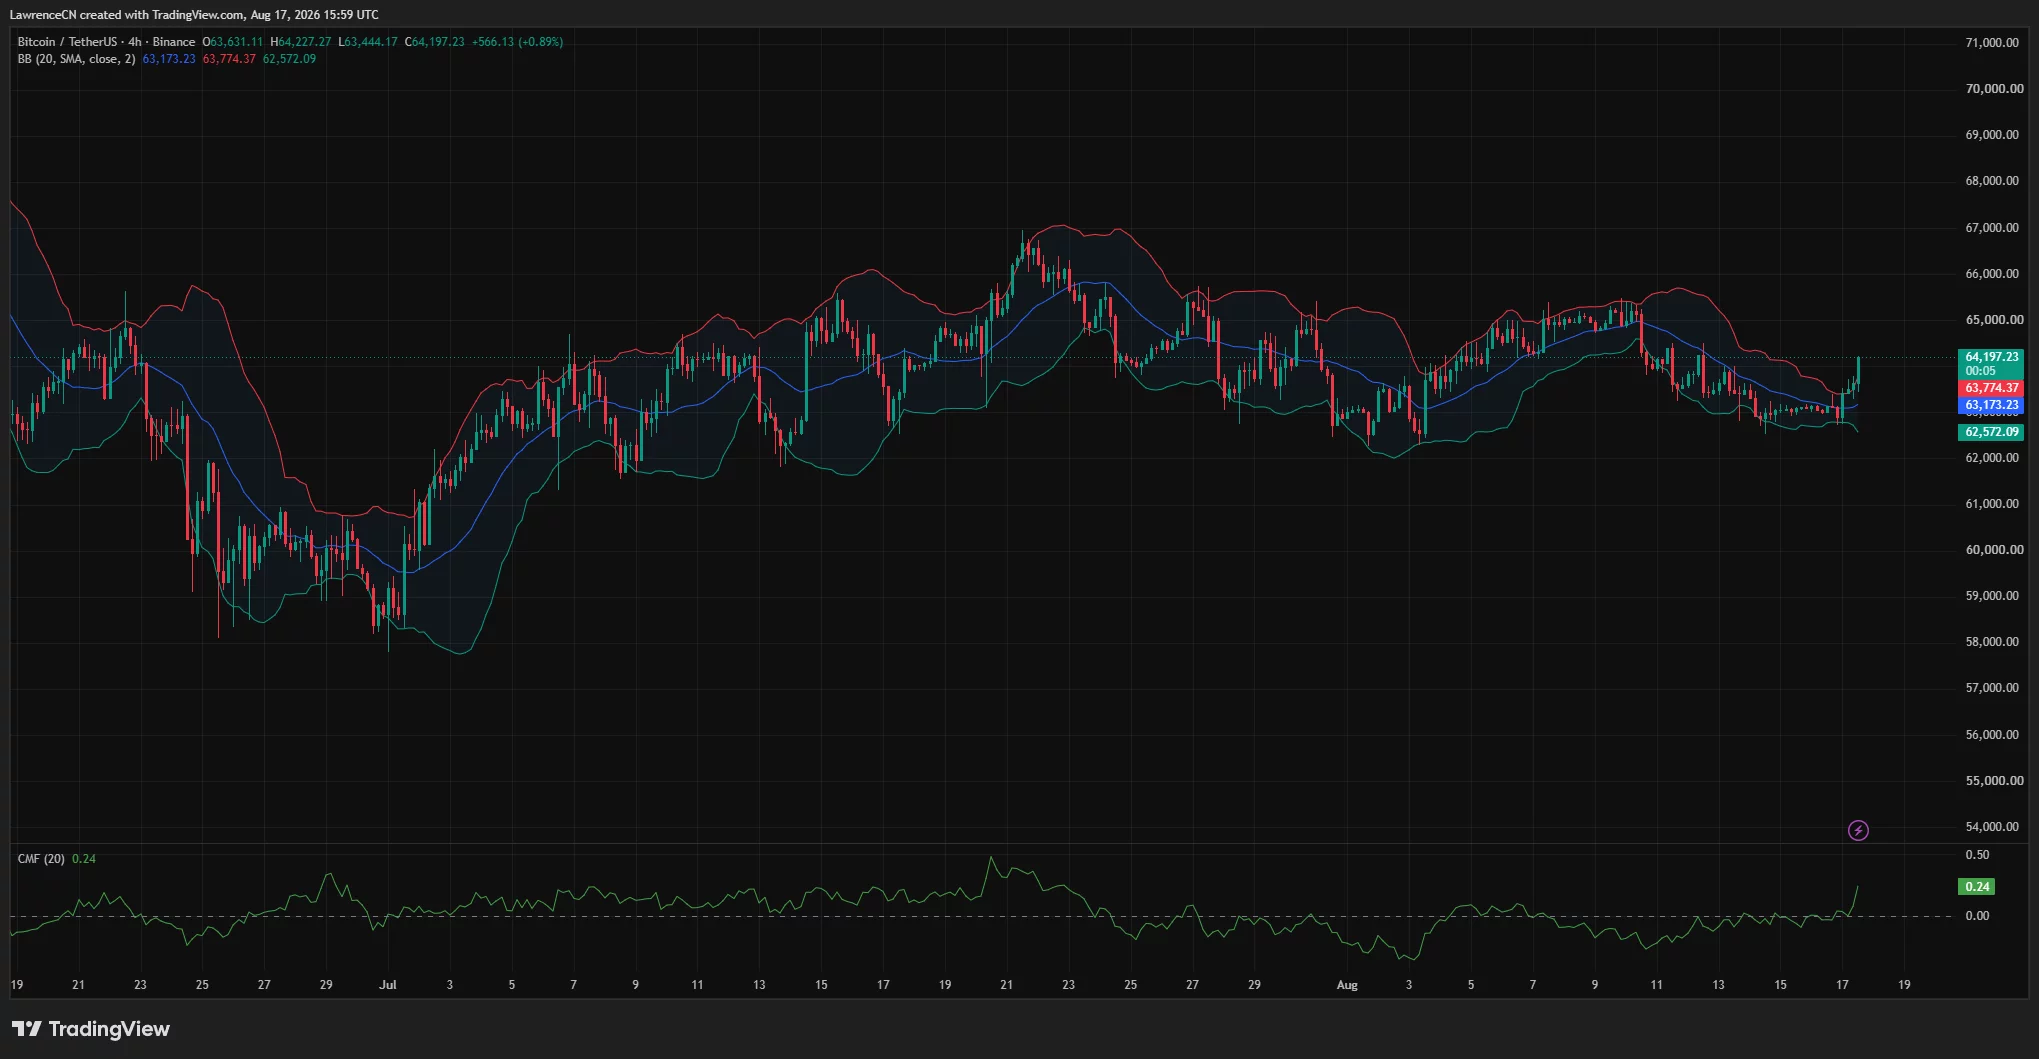
Chaikin Money Flow on the same timeframe rose to 0.24, indicating that buying volume supported the move. A price holding above $63,774 would keep the immediate focus on the $64,700–$65,000 resistance area.
Glassnode warns of a low-volatility trap
Bitcoin’s rebound comes as the options market prices in one of the quietest trading environments in its history.
Glassnode co-founder Rafael Schultze-Kraft said in an X post that Bitcoin’s implied volatility had fallen into the lowest 2% of its historical distribution. Implied volatility measures the degree of future price movement expected by options traders rather than the direction of that move.
Despite reaching a historical low, implied volatility remains around 1.5 times higher than Bitcoin’s recent realized volatility, according to Schultze-Kraft. The gap means options traders are still paying a notable volatility premium even though actual price movements have been unusually narrow.
Glassnode’s volatility trap score has consequently climbed to 91 out of 100, its highest reading in more than three and a half years. Schultze-Kraft cautioned that low implied volatility alone does not automatically make options cheap because realized volatility has fallen even further.
Past periods of severe compression have often preceded larger price swings, but the Glassnode data does not indicate whether the next expansion will be higher or lower. Capital flows, macroeconomic policy and new market catalysts could determine the direction.
Bitcoin’s recent range reflects that uncertainty. BTC has largely traded between $62,000 and $65,000 since late July despite several brief moves outside those levels.
BTC daily indicators remain weak
Bitcoin’s daily chart has not yet confirmed a broader bullish reversal, even after the latest rebound.
The daily moving average convergence divergence indicator remains below its signal line. The MACD reading stood near minus 183, compared with a signal-line reading near minus 101, while the histogram remained negative at around minus 82. The readings show that bearish momentum from the recent decline has not fully cleared.
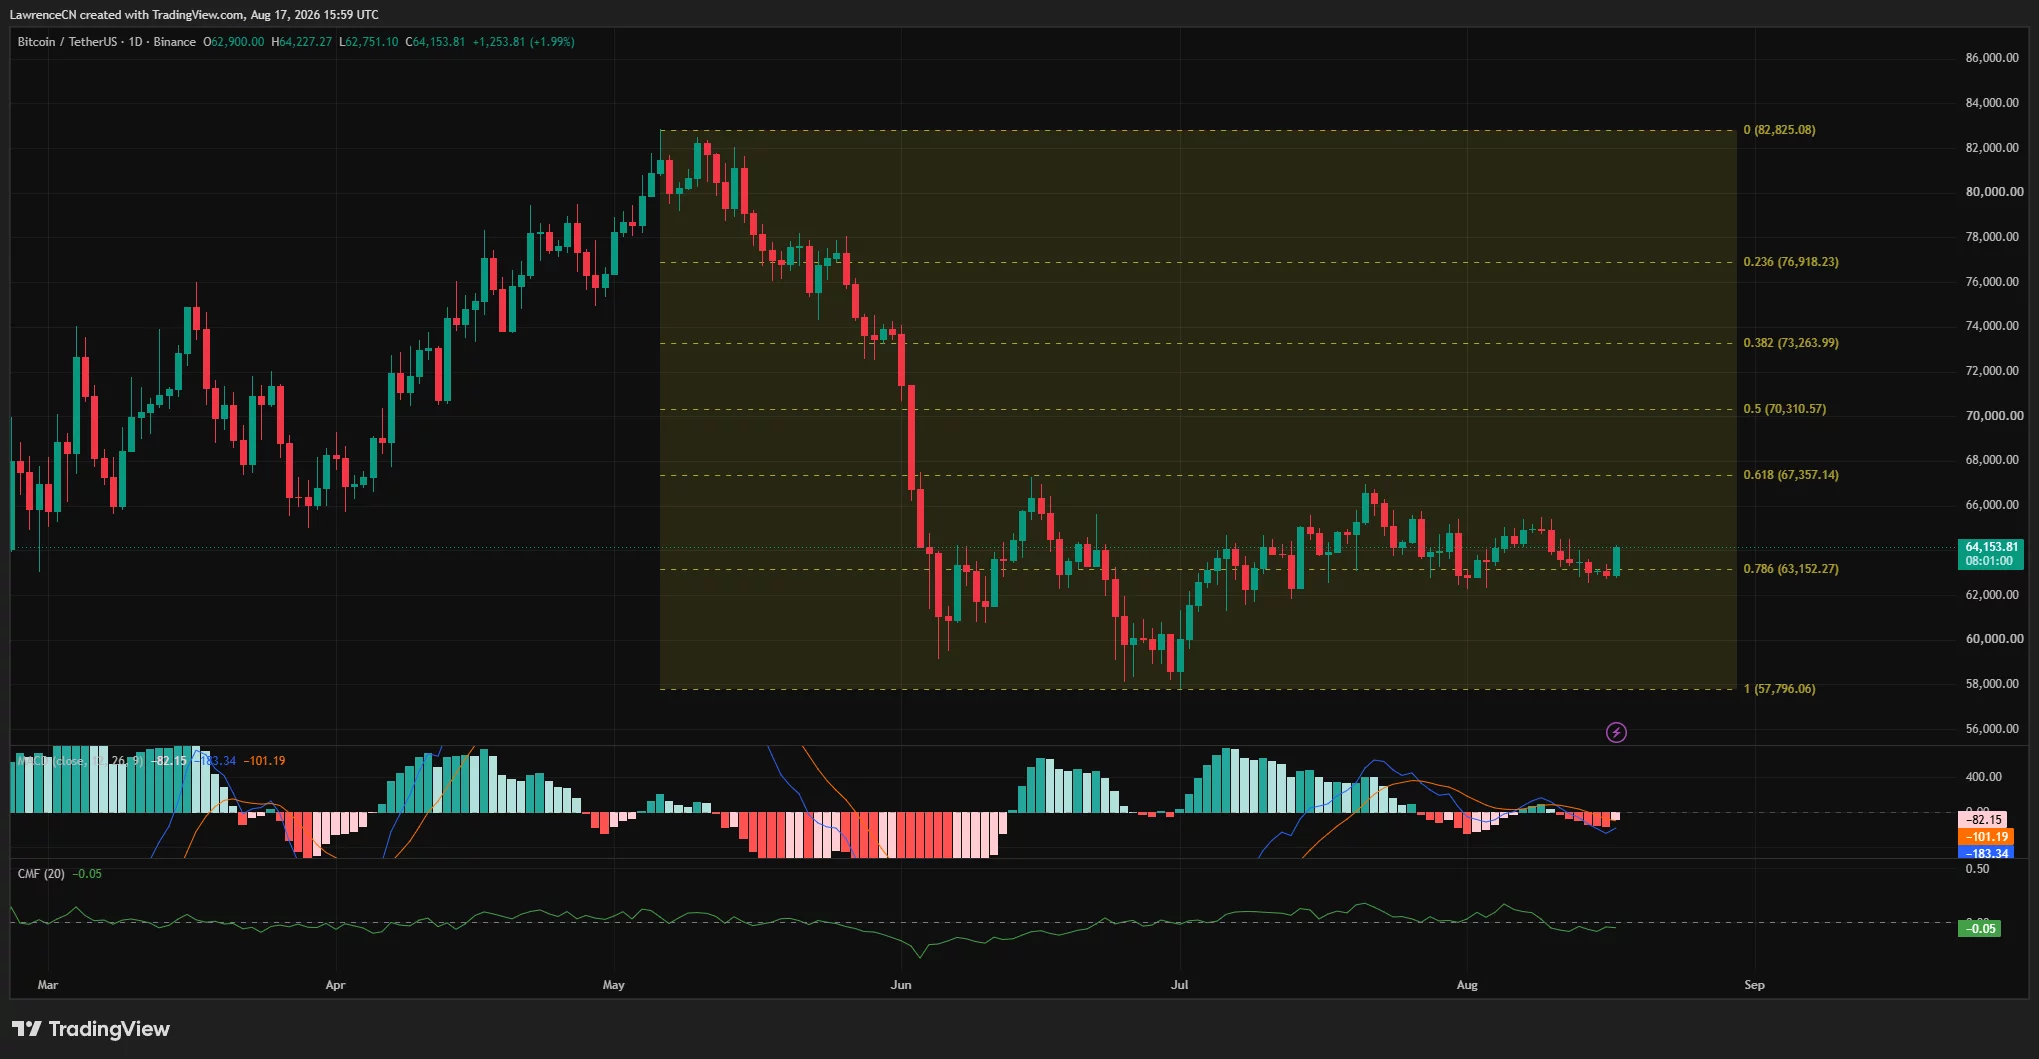
Daily Chaikin Money Flow also remained slightly negative at minus 0.05. The contrast with the 4-hour reading of 0.24 suggests that buyers have returned in the short term, although broader capital flows remain weak.
A daily close above $64,000 would strengthen the recovery and open a path toward $65,000. The next larger upside level sits near $67,357, corresponding with the 61.8% Fibonacci retracement of Bitcoin’s decline from $82,825 to $57,796.
Failure to hold the $63,152 Fibonacci level would put $62,500 back in focus. A deeper breakdown could expose the $60,000 area, while the full retracement low near $57,796 represents the broader bearish level visible on the daily chart.
Liquidation levels place BTC between $62,200 and $64,700
CoinGlass’ one-week liquidation heatmap shows large concentrations of leveraged positions on both sides of Bitcoin’s current price.
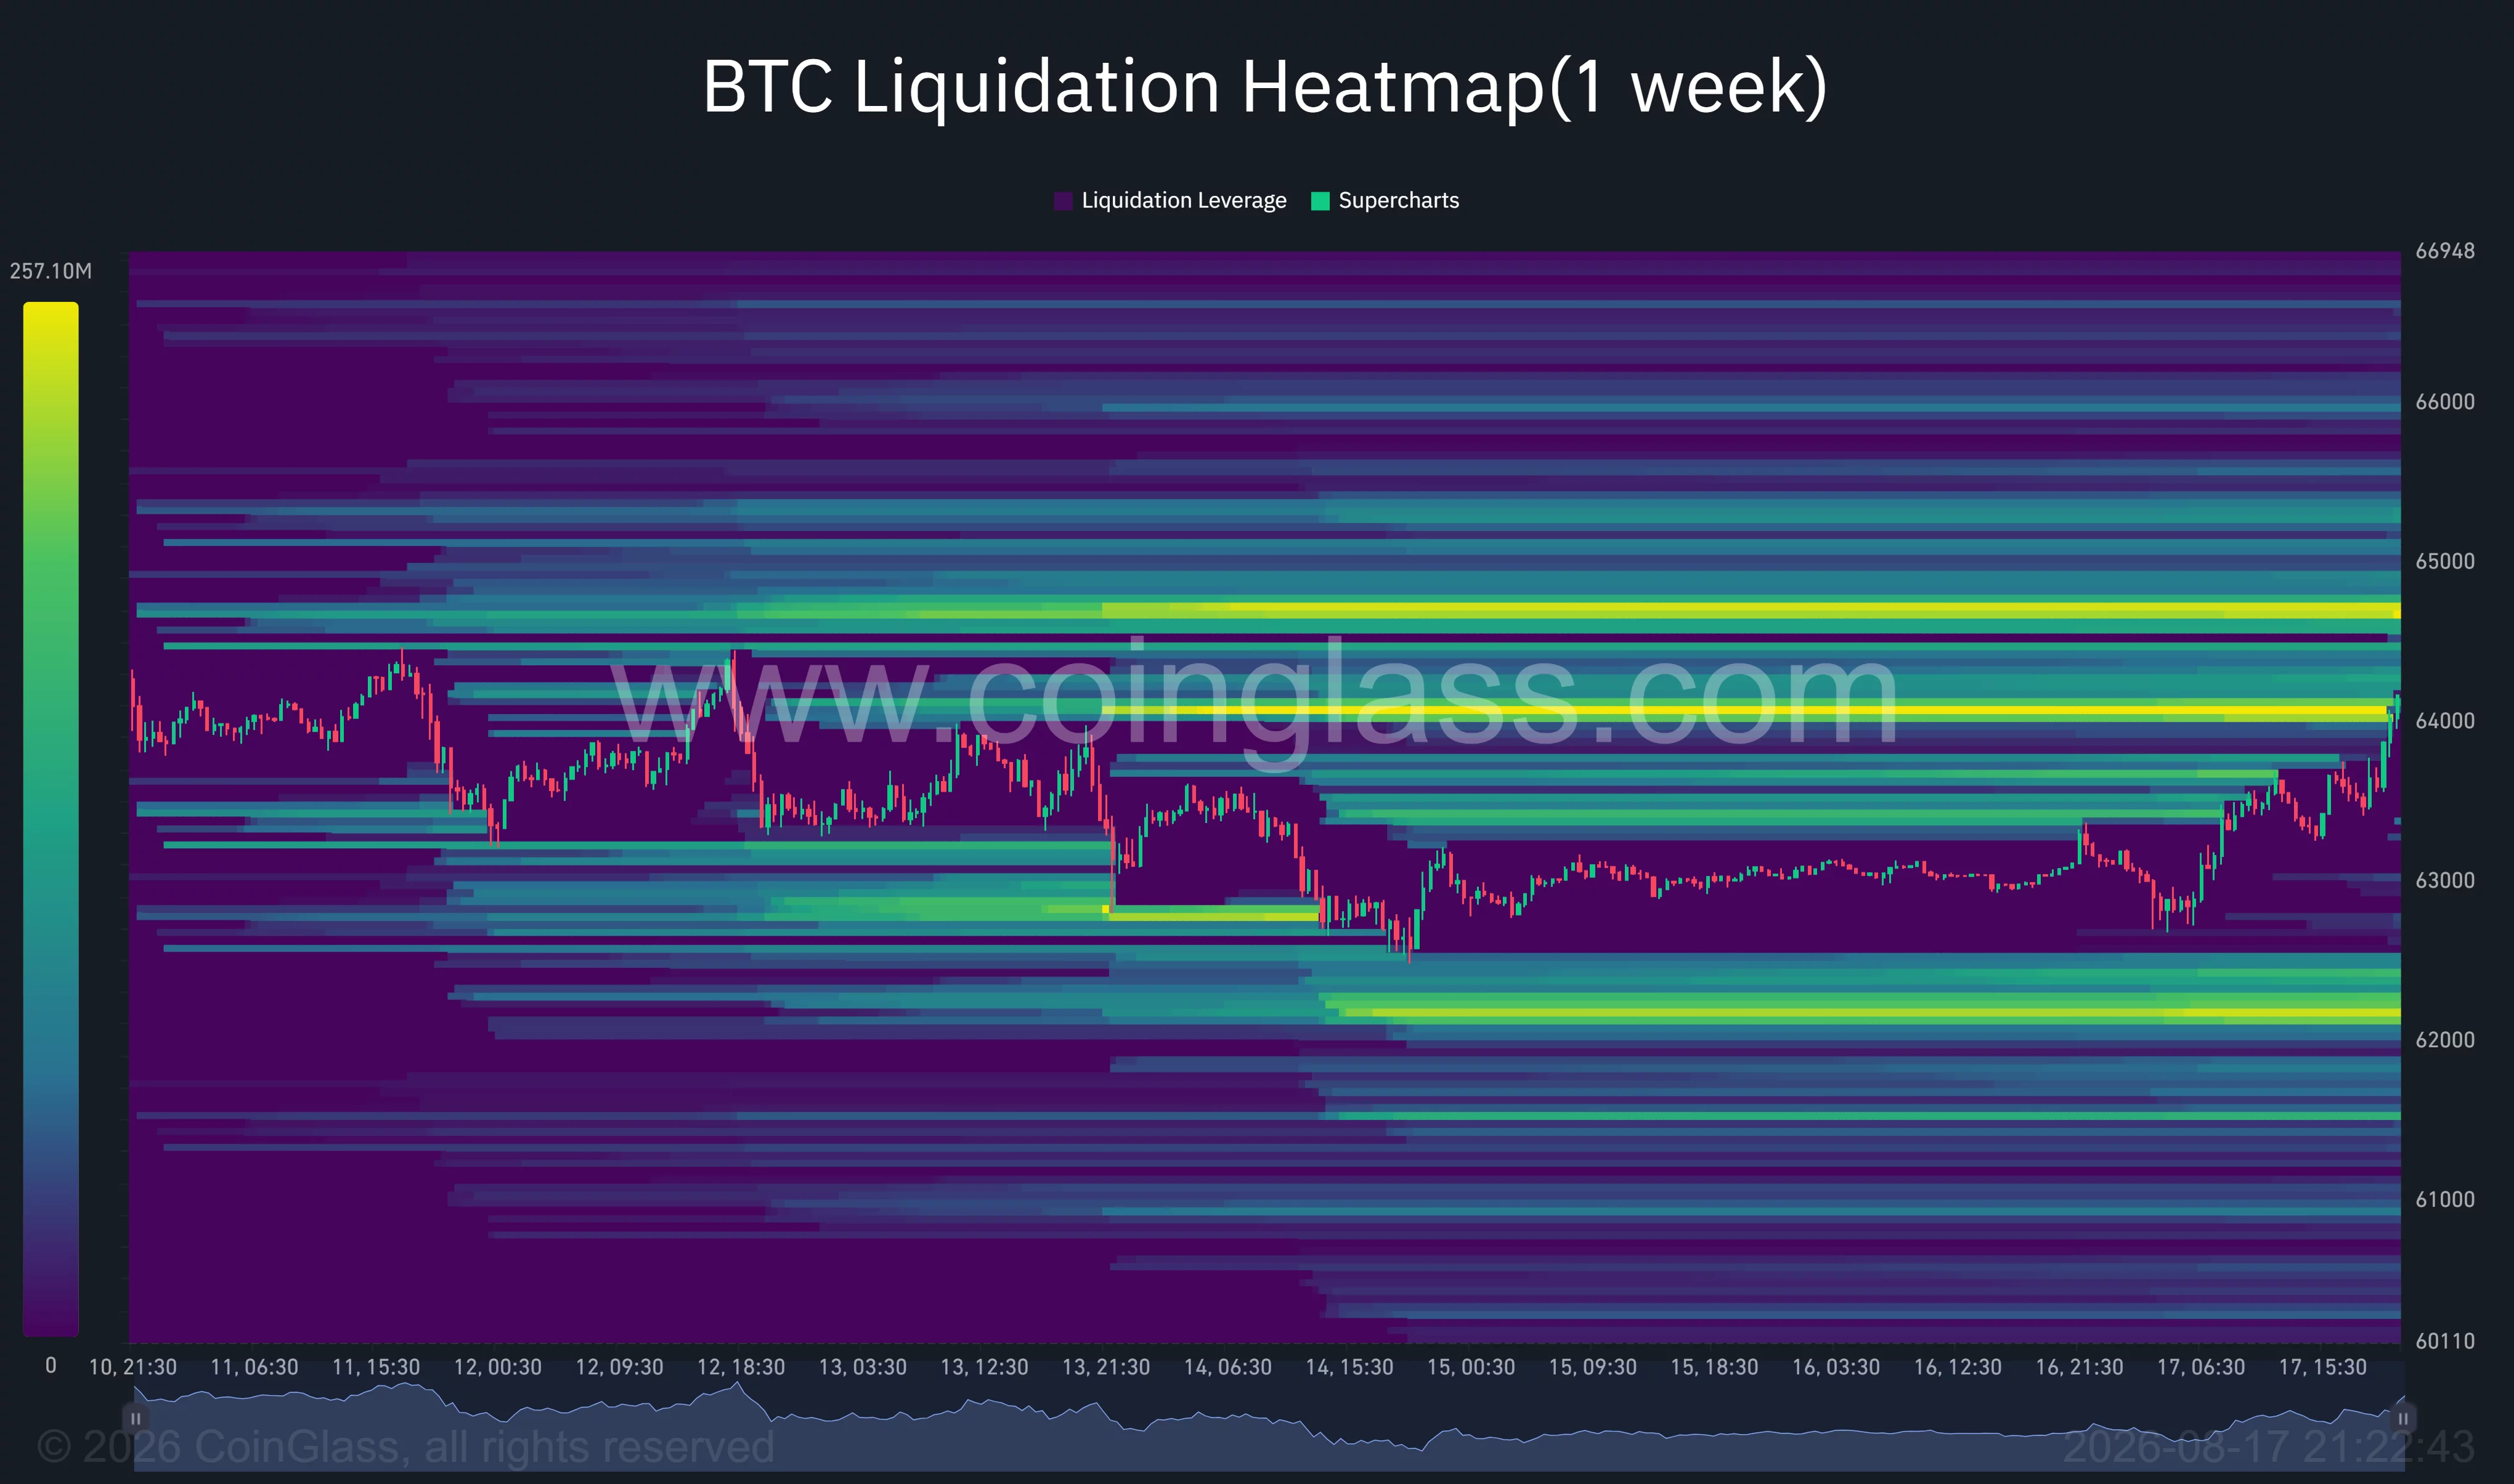
The nearest strong overhead cluster sits around $64,000, with a larger concentration near $64,700. A move through those levels could force short sellers to close positions, adding buying pressure and potentially pushing BTC toward $65,000.
Downside liquidity is concentrated near $62,700 and $62,200. A rejection from the current level could draw the price back toward those zones and trigger liquidations among leveraged long traders.
The heatmap therefore supports a near-term range between roughly $62,200 and $64,700. Glassnode’s volatility data suggests that Bitcoin may not remain inside such a narrow range indefinitely, but it does not establish which boundary will break first.
Fed minutes and CLARITY Act could guide Bitcoin
Mei said traders will monitor the Federal Open Market Committee minutes for clues about the Federal Reserve’s interest-rate outlook. Expectations for lower rates matter to crypto markets because easier financial conditions can increase the liquidity available for risk assets.
“The big things to keep an eye on this week are the FOMC minutes, which’ll give us a peek into what the Fed’s actually thinking on rates, and whether the CLARITY Act gets any attention in the Senate before they head out for recess,” Mei said.
The BTSE executive argued that uncertainty over the CLARITY Act has held back some large institutional investors. He also said traders continue to favor artificial intelligence stocks, leaving crypto in need of stronger institutional inflows or greater macro liquidity to support another sustained advance.
According to Mei, such a shift would likely require clearer evidence that the U.S. economy is slowing enough to justify rate cuts. Until ETF demand strengthens or the Federal Reserve signals easier policy, Bitcoin’s recovery may remain vulnerable near the upper end of its recent range.
Disclosure: This article does not represent investment advice. The content and materials featured on this page are for educational purposes only.