Circle shrugs off Jefferies warning as USDC dominates stablecoin trades


Circle shares have climbed despite a bearish analyst note from Jefferies, as fresh data has shown USDC processed more than twice the adjusted stablecoin trading volume of Tether’s USDT in June.
- Circle shares gained despite a bearish Jefferies note as USDC led stablecoin trading volumes in June.
- Visa data showed USDC processed $1.21 trillion in adjusted volume, more than double USDT’s $573 billion.
- CRCL is rebounding from key support, but bulls must clear the Supertrend resistance to confirm a trend reversal.
According to Grayscale Head of Research Zach Pandl, stablecoins recorded a record $1.78 trillion in adjusted trading volume during June 2026. Visa data cited by Pandl showed Circle’s USDC accounted for about $1.21 trillion of that activity, giving it a 67% share of total stablecoin trading volumes. USDT processed $573 billion during the same period.
While Tether trailed USDC in transaction value, it handled the highest number of transfers, recording 145 million transactions compared with USDC’s 57 million.
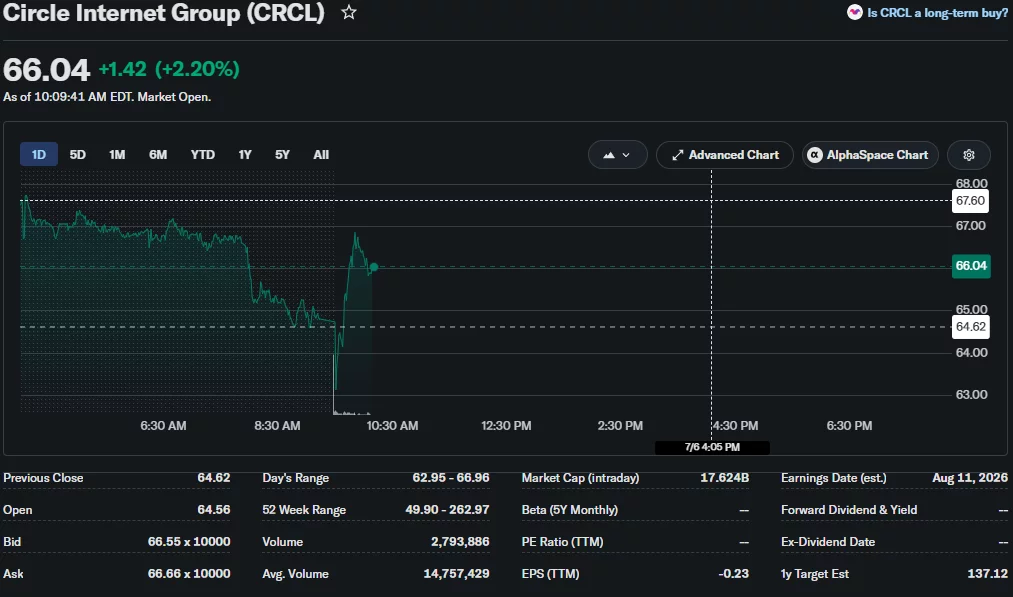
Circle Internet Group’s stock has responded positively to those figures. CRCL closed 4% higher at $64 on July 2 and was trading around $66 in pre-market trading on July 6, extending gains even after Jefferies advised investors against buying the stock over concerns that a new rival stablecoin could pressure Circle’s market position.
USDC volume lead eases pressure from new rival
Jefferies warned investors on July 2 that the launch of the OUSD stablecoin could weaken Circle’s position in the stablecoin market and weigh on its valuation. The caution came after CRCL posted its largest one-day decline since March on June 30, when the stock sold off following OUSD’s launch and Circle’s removal from several Russell indexes.
However, some of those concerns have faded after questions emerged over Open Standard’s claims of having 140 partners. Samsung and Dunamu, both previously listed as partners, later distanced themselves from the project, casting doubt on some of the announced industry backing.
Institutional buying also provided support. On the same day Jefferies published its bearish note, ARK Invest disclosed purchases of roughly $17.8 million worth of Circle shares despite the cautious outlook.
USDC has nevertheless recorded a slight decline in supply. Circle’s stablecoin market capitalization slipped from $73.75 billion on June 30 to $72.87 billion by July 6, indicating some capital rotated elsewhere following the OUSD launch even as USDC maintained a commanding lead in transaction volume.
Technical rebound faces major resistance
From a technical perspective, CRCL has rebounded after finding support near the 1.0 Fibonacci extension at $61.73 on the four-hour chart. Buyers have defended that level over recent sessions, helping the stock recover from around $62 to nearly $66.
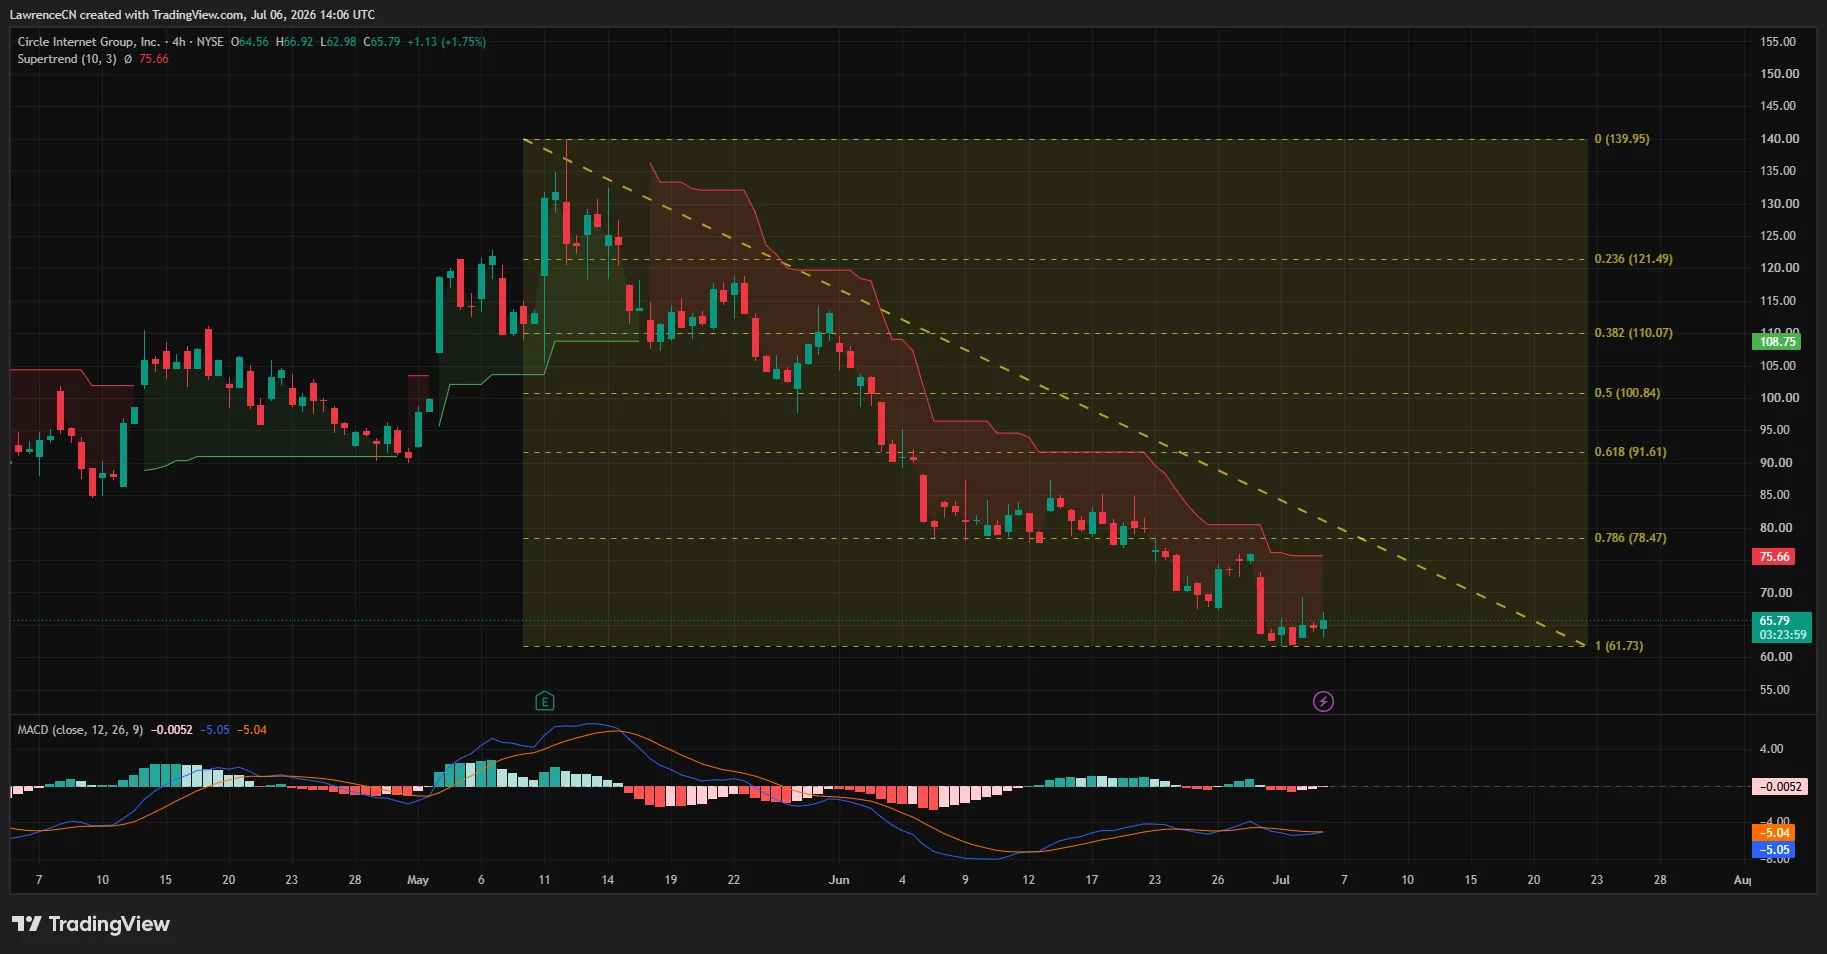
The recovery, however, has yet to change the broader technical picture. CRCL remains below the Supertrend indicator, which sits near $75.66 and continues to signal that sellers retain control. Reclaiming that level would be the first indication that bullish momentum is strengthening.
Momentum indicators are beginning to improve. The MACD histogram has almost returned to the zero line after several weeks of negative readings, suggesting selling pressure is fading. However, the MACD line remains below the signal line, meaning a confirmed bullish crossover has not yet occurred.
If buyers push the stock above the Supertrend resistance, the next upside levels to watch are the Fibonacci retracement zones near $78.47, followed by $91.61 and $100.84. On the downside, losing support around $61.73 would weaken the current recovery attempt and increase the risk of another move lower.
Disclosure: This article does not represent investment advice. The content and materials featured on this page are for educational purposes only.