Ethereum price forms bullish triangle as ETF inflows hit 7-day streak, is a breakout next?


Ethereum price fell to an intraday low of nearly $2,250 on Monday as hopes for a peace deal in the U.S.–Iran conflict faded.
- Ethereum price fell over 3% to $2,258, down more than 6% from its recent high, as U.S.–Iran tensions weighed on risk sentiment.
- Ethereum price continues to consolidate within a multi-month ascending triangle, with $2,378 as key resistance and $2,200 as downside invalidation.
- Spot Ethereum ETFs recorded a 7-day inflow streak totaling $425 million, signaling sustained institutional demand
According to data from crypto.news, Ethereum (ETH) price fell over 3% to $2,258 on Monday before settling around $2,300 at press time. The token has fallen over 6% from its Friday high after tensions between the U.S. and Iran escalated over the Strait of Hormuz, driving oil prices higher again and deteriorating investor appetite for risk assets, including cryptocurrencies.
With recent reports confirming that Iran will not be attending the peace negotiations with the U.S. in Islamabad today, investors have entered a wait-and-watch mode as they await further clarity on the geopolitical landscape.
Despite the bearish market environment, a look at Ethereum charts shows that the token is currently consolidating within a critical technical structure.
On the daily chart, Ethereum price action has been forming a multi-month ascending triangle pattern formed of a flat resistance level and rising support. Typically, a breakout from the horizontal trend line of the pattern, which acts as a major resistance line, confirms a bullish breakout from the pattern and leads to a significant price rally.
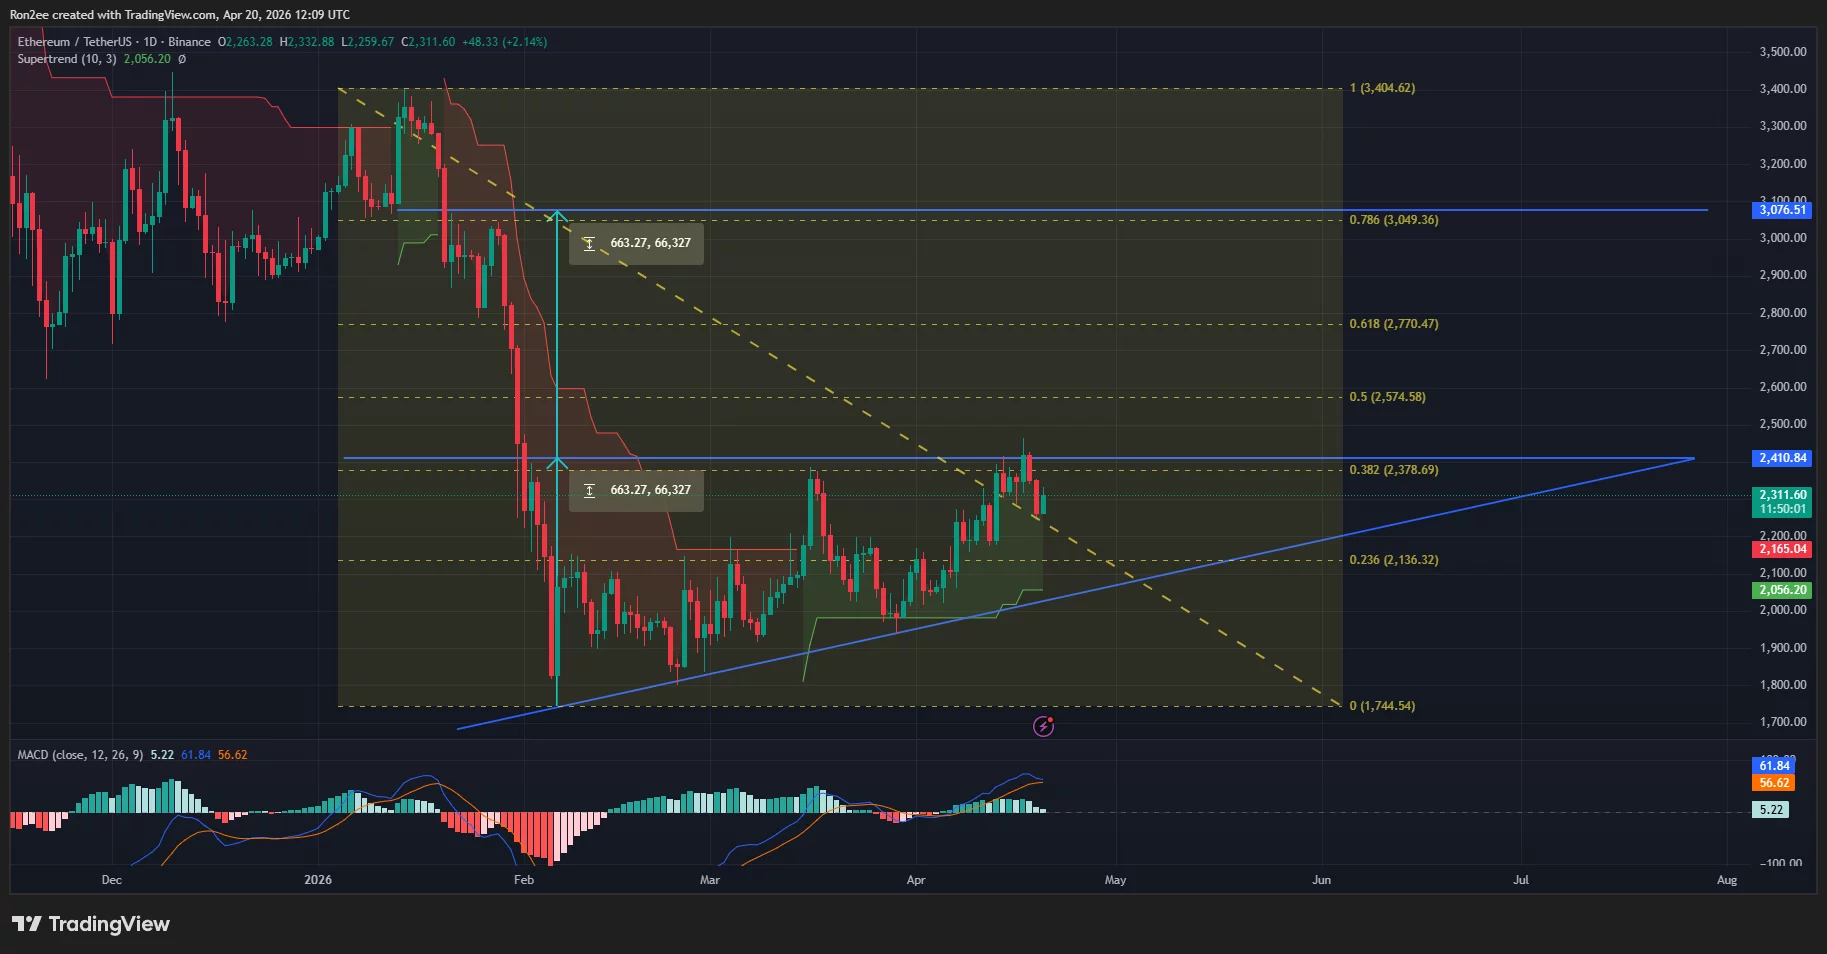
For Ethereum, a breakout from the pattern could position it for an upside to $3,076, a target calculated by adding the height of the ascending triangle formed to the point at which the price eventually breaches the resistance.
Technical indicators seem to indicate bullish momentum building that could support the price prediction. Notably, the SuperTrend has flashed green, a sign of a potential trend reversal to the upside, while the MACD lines were trending above the neutral line.
For now, $2,378, which aligns with the 38.2% Fibonacci retracement level, is the next key resistance level to keep an eye on. A breakout from this level could accelerate a breakout from the larger pattern. On the contrary, a drop below $2,200 would invalidate the current bullish setup and invite further downside.
Institutional demand for Ethereum remains steady
The bullish outlook for Ethereum could gain support from the fact that spot Ethereum ETFs have been seeing back-to-back inflows, suggesting that institutional investors have maintained a positive long-term conviction despite the ongoing geopolitical noise.
Data from SoSoValue shows the 10 spot Ethereum ETFs recorded their seventh straight day of inflows on Friday last week, bringing in $425 million over the period. As such, if the accumulation trend extends to the coming weeks, it could provide the necessary liquidity to push Ethereum toward its bullish price targets.
Disclosure: This article does not represent investment advice. The content and materials featured on this page are for educational purposes only.