Ethereum price nears breakout point as $1,600 resistance comes into focus


Ethereum price has approached a decisive technical level as traders weigh mounting institutional accumulation against continued ETF-driven selling pressure.
- Ethereum price remains stuck below $1,600 as ETF outflows and weak market sentiment cap upside momentum.
- Technical indicators show $1,600-$1,750 as the key resistance zone, while $1,500 remains critical support.
- SharpLink’s $62.4 million ETH purchase offers a bullish signal, but macro risks continue to pressure prices.
According to data from crypto.news, Ethereum (ETH) price traded around $1,580 on June 29 after spending the past four days moving sideways between roughly $1,550 and $1,600.
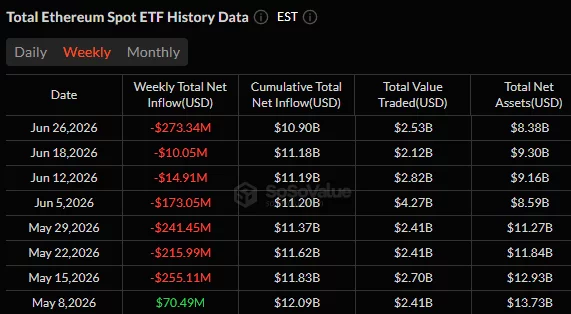
The consolidation follows another week of selling pressure across spot Ethereum exchange-traded funds, while traders continue to watch whether buyers can reclaim higher resistance before the current range breaks in either direction.
Spot Ethereum ETFs remain one of the largest headwinds. The funds recorded $273 million in net outflows during the week ending June 26, extending their losing streak to seven consecutive weeks. BlackRock’s ETHA accounted for $236 million of those withdrawals, forcing fund managers to redeem underlying Ether as investors exited the products. Those steady spot-market sales have repeatedly capped recovery attempts around the $1,600 area.
Elsewhere, Ethereum’s own ecosystem has provided little immediate relief. The Ethereum Foundation recently confirmed a 20% reduction in staff alongside a 40% cut to its operating budget. Developers also delayed the Glamsterdam network upgrade until the second half of 2026, removing one of the network’s biggest expected catalysts over the coming quarters.
Together, those developments have kept sentiment defensive even as Ethereum continues to dominate decentralized finance activity.
Corporate accumulation, however, has started to emerge beneath the surface. According to Whale Factor, SharpLink Gaming returned to the market after an eight-month pause by purchasing nearly 40,000 ETH worth approximately $62.4 million. While the purchase has yet to change short-term price action, it adds another publicly visible treasury buyer accumulating Ether during the current correction.
Ethereum faces heavy resistance between $1,640 and $1,750
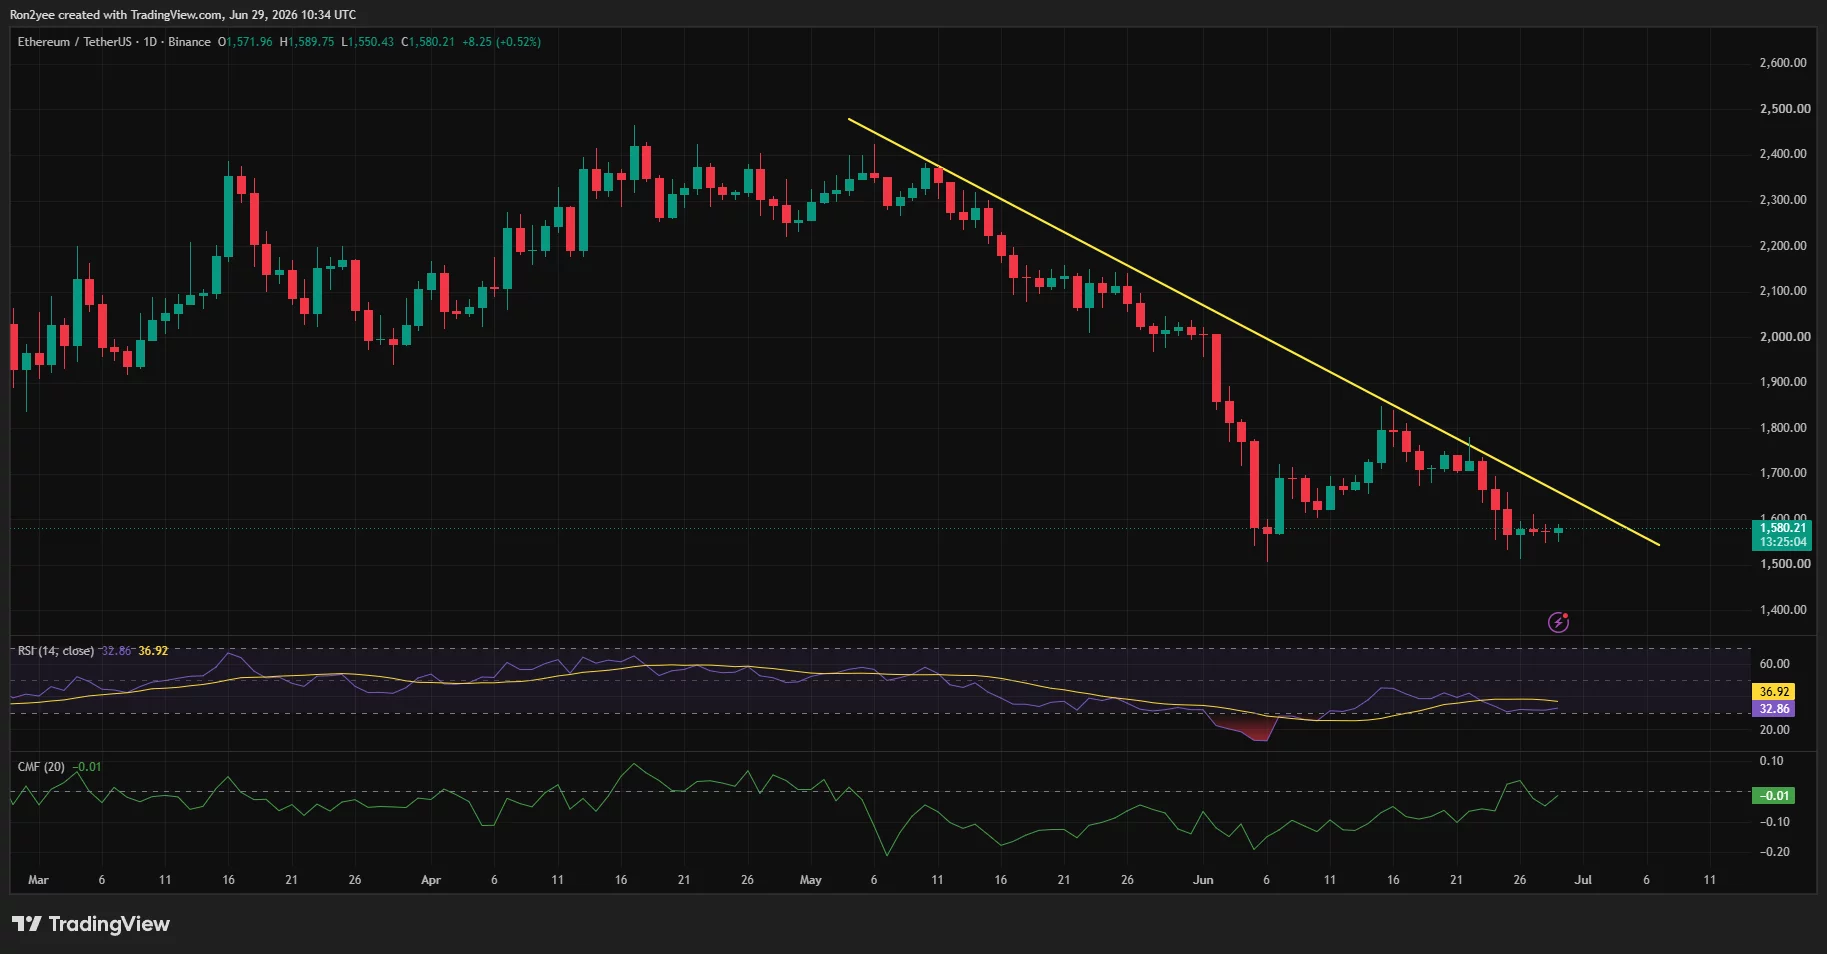
Ethereum’s technical picture continues to favor sellers despite the recent stabilization. The daily chart shows price trading beneath a descending trendline that has controlled the market since mid-May, while ETH also remains below the Supertrend indicator near $1,644.
The 4-hour chart presents repeated failures around the 0.618 Fibonacci retracement at $1,642, with the 0.786 level near $1,585 acting as immediate support inside the current consolidation.
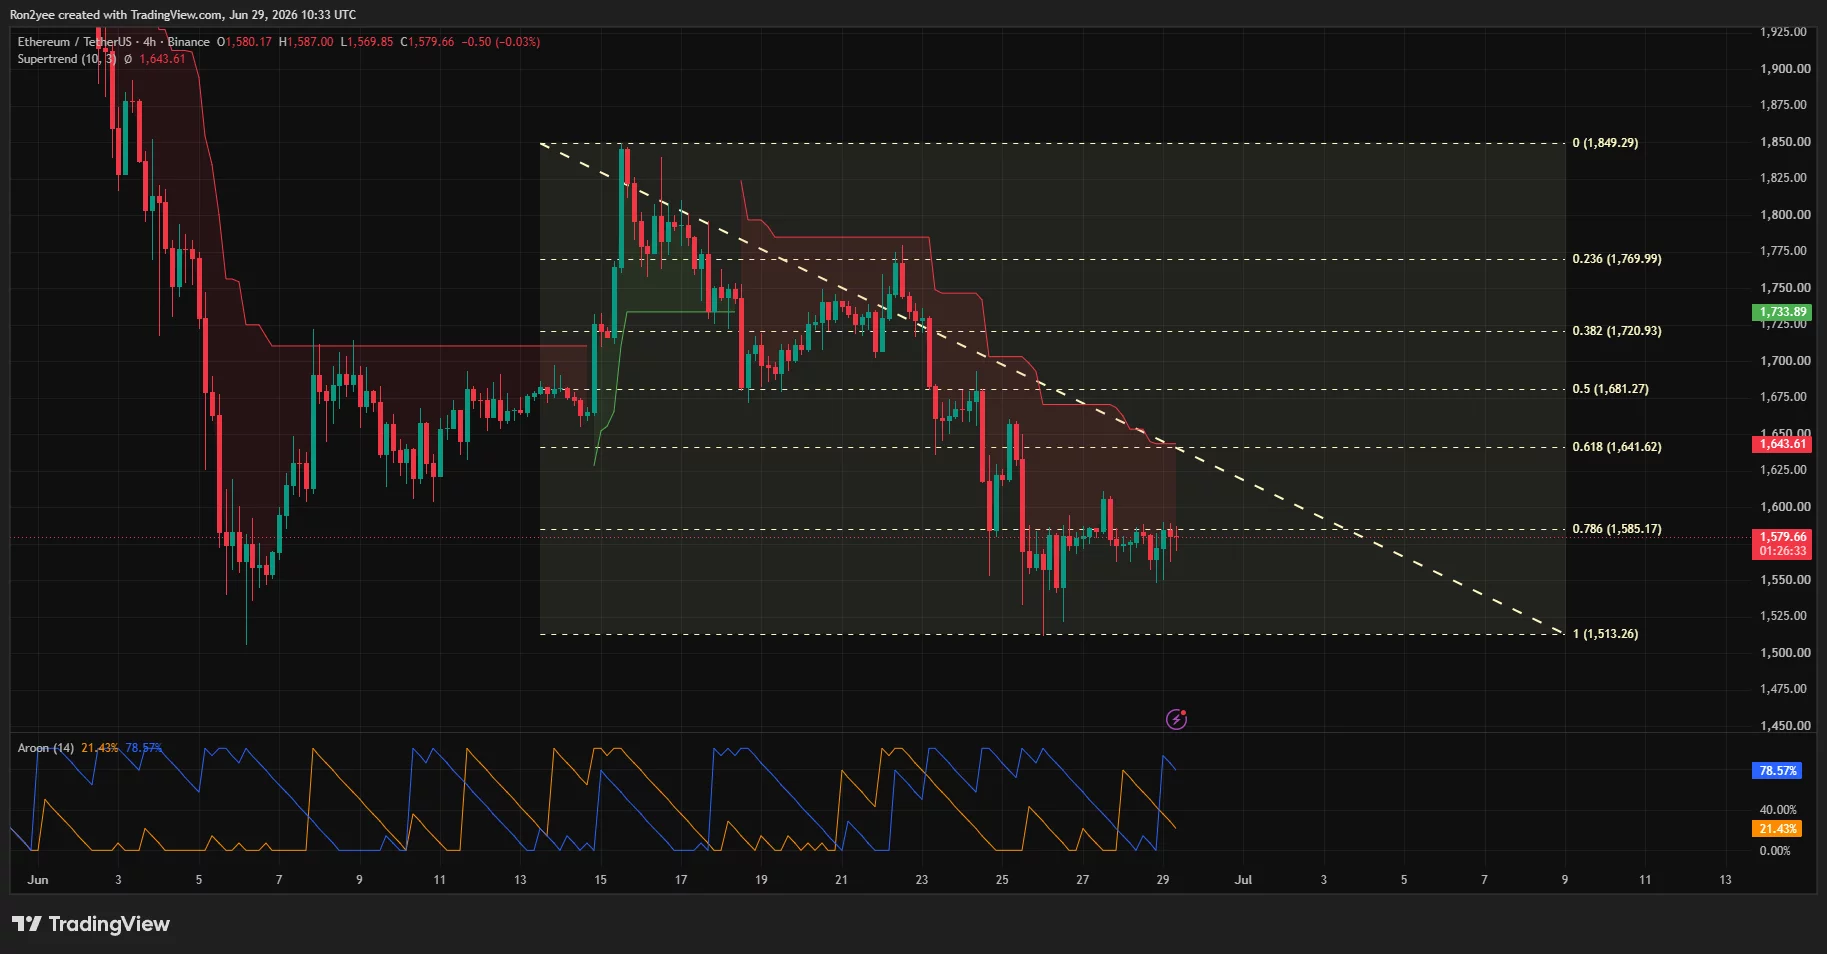
Momentum indicators have yet to confirm a sustained recovery. The daily RSI sits near 33, leaving ETH above deeply oversold territory but still firmly below the neutral 50 level. Chaikin Money Flow remains slightly negative near -0.01, showing that capital has not yet returned decisively to the market. Meanwhile, the Aroon indicator on the four-hour chart continues to favor sellers, with Aroon Down holding well above Aroon Up after several unsuccessful recovery attempts.
Derivatives positioning highlights the importance of nearby liquidation zones. CoinGlass liquidation heatmaps show dense leveraged positions clustered between roughly $1,610 and $1,630, with another larger concentration sitting closer to $1,650.
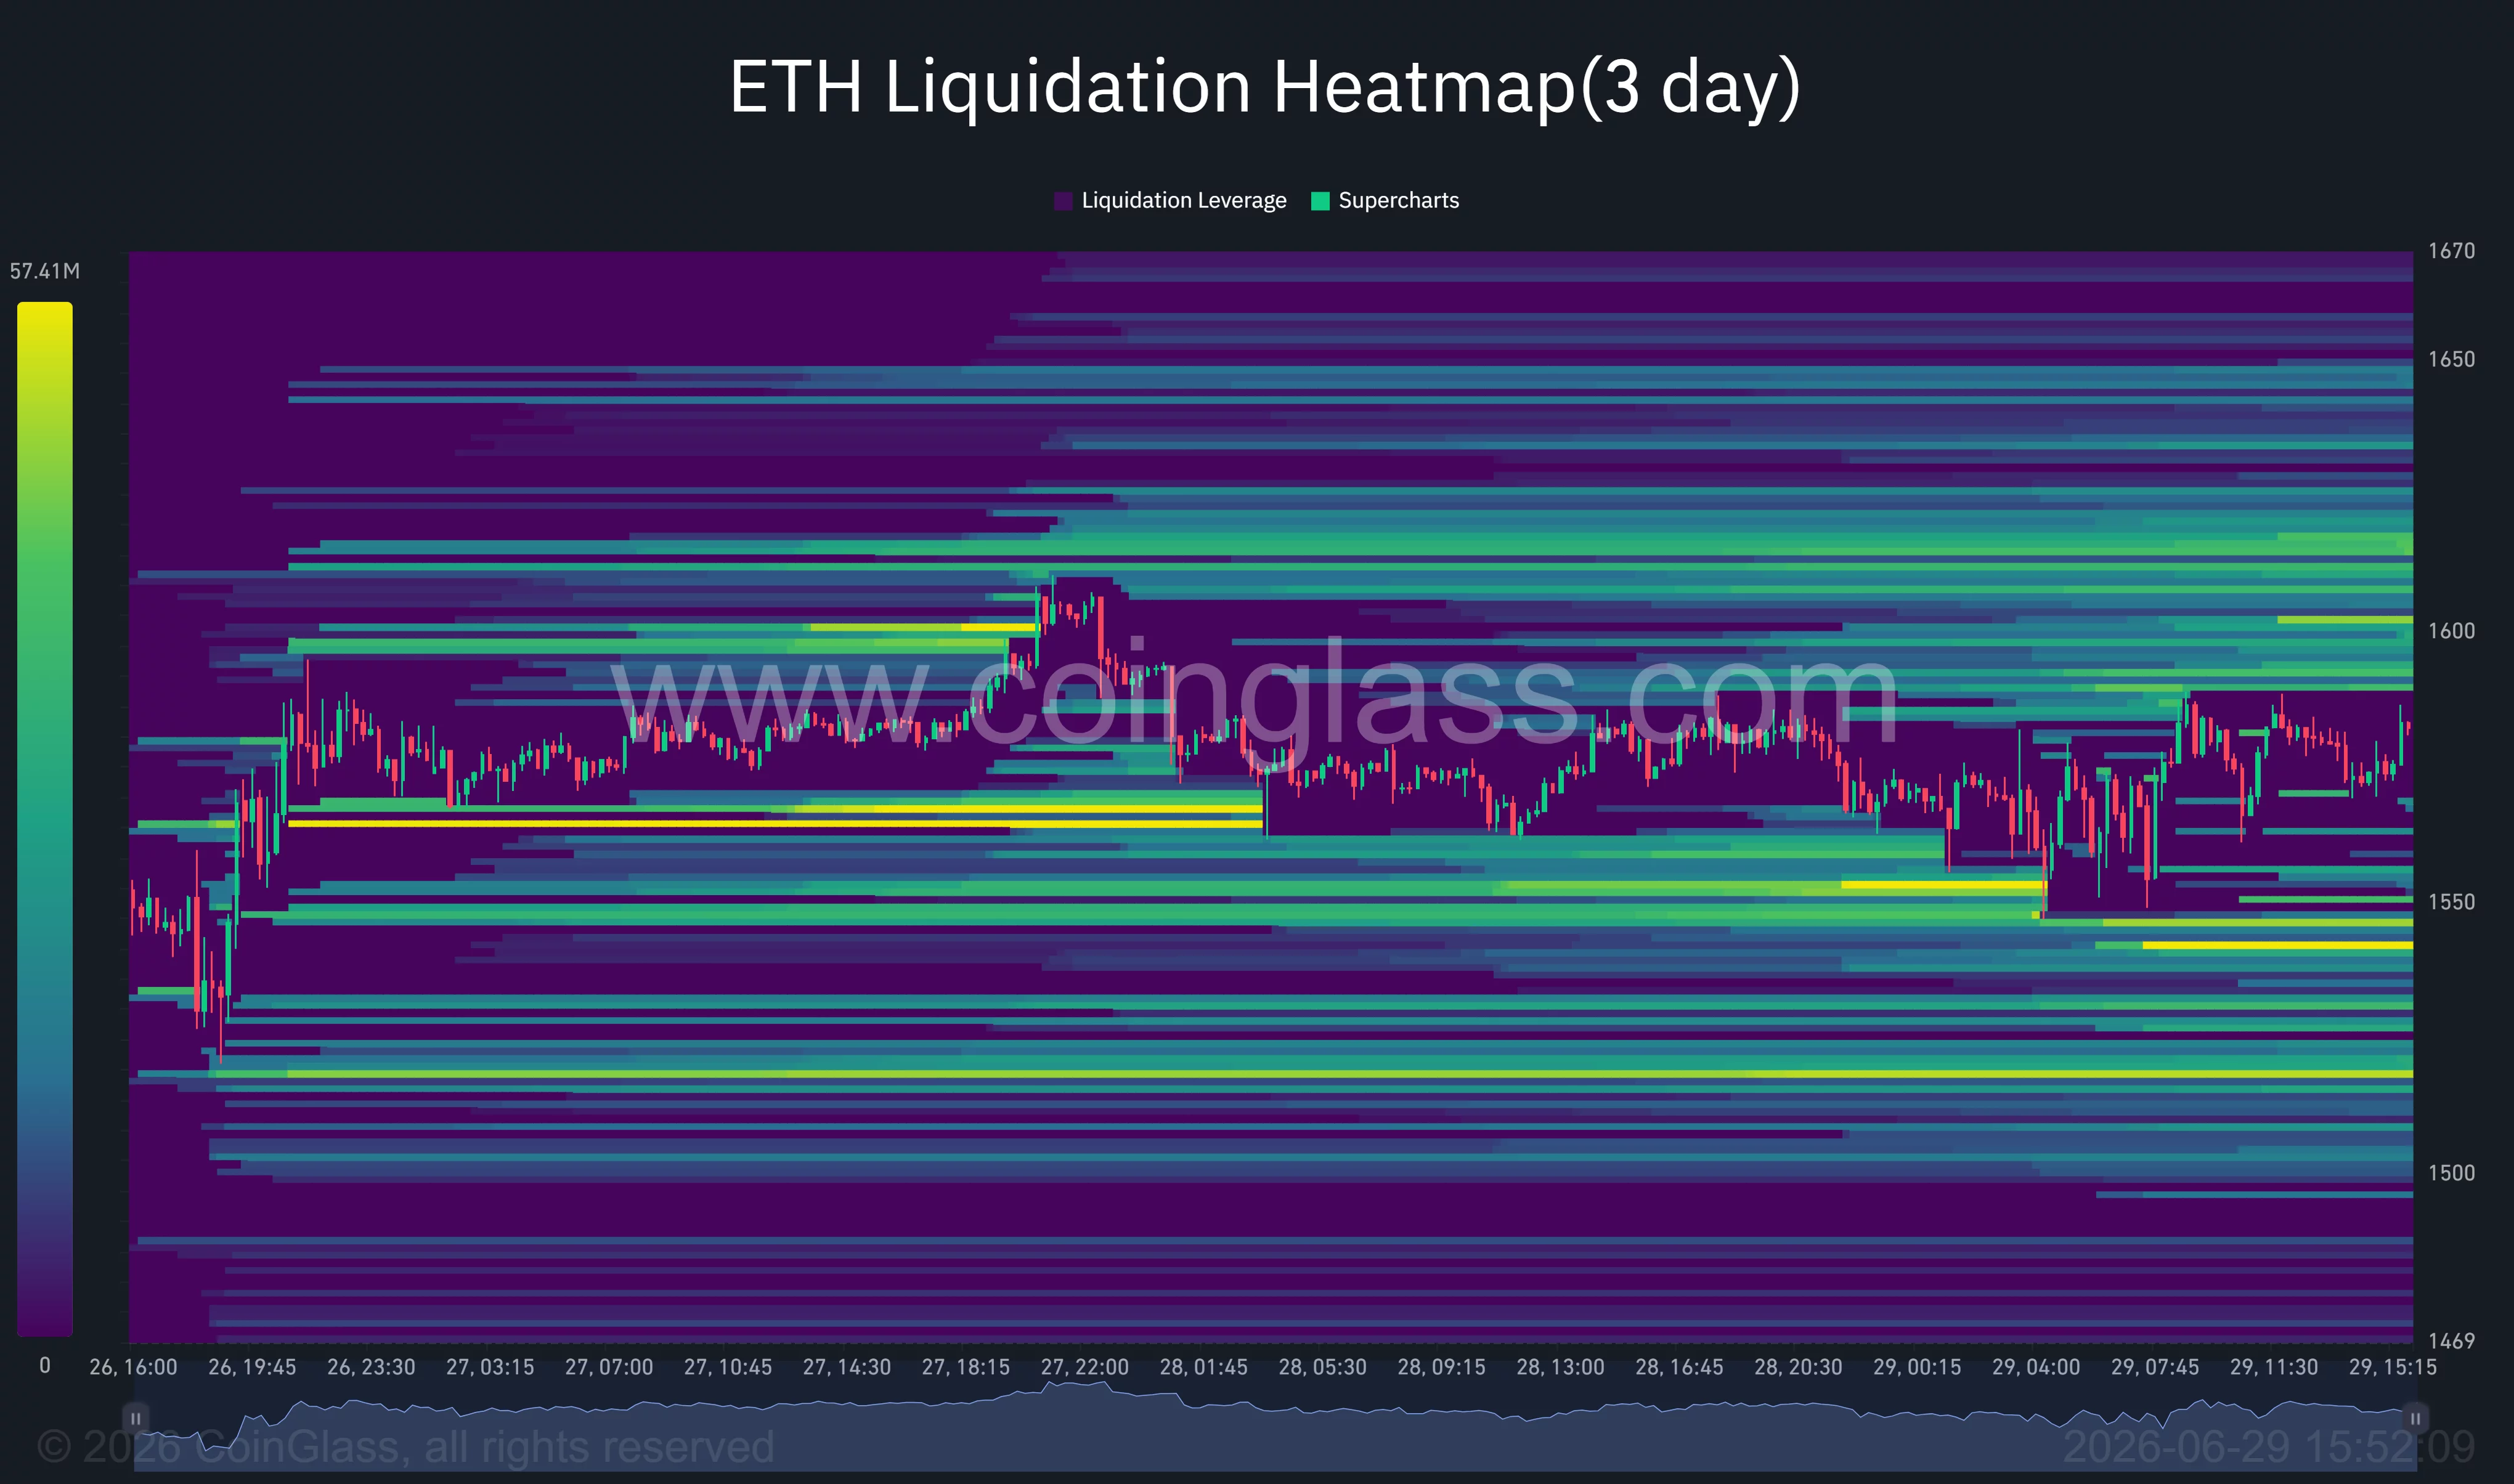
A move through those levels could trigger short liquidations and accelerate momentum toward the $1,700-$1,750 region, while liquidity below $1,550 remains comparatively thinner.
Commenting on the current setup, well-followed analyst Ted Pillows wrote on X:
“Reclaim the $1,750 level and there’ll be a decent rally. Lose the $1,500 level and Ethereum will have its capitulation.”
His view aligns with the descending resistance visible on the daily chart, where $1,750 also coincides with previous support that turned into resistance after June’s breakdown.
Losing $1,500 would strengthen the bearish outlook
The bullish case still depends on Ethereum reclaiming several technical barriers in quick succession. A close above the descending trendline would expose the Supertrend resistance near $1,644, followed by the Fibonacci levels around $1,682 and $1,721 before traders begin targeting the psychological $1,750 threshold.
Several downside risks remain in place if buyers fail to regain control. Sticky U.S. inflation has reduced expectations for near-term Federal Reserve rate cuts, keeping Treasury yields elevated and limiting liquidity available for risk assets. Bitcoin’s move below $60,000 has also pushed more capital toward the largest cryptocurrency instead of major altcoins.
If Ethereum loses the $1,500 support that has held throughout the latest consolidation, the current range would likely give way to another wave of selling as leveraged long positions unwind and bearish momentum accelerates.
Disclosure: This article does not represent investment advice. The content and materials featured on this page are for educational purposes only.