
Bitcoin
Bitcoin (BTC)
$74,848.00 7.8
Bitcoin price
Ethereum
Ethereum (ETH)
$2,347.02 4.5
Ethereum price
XRP
XRP (XRP)
$1.31 19.7
XRP price
BNB
BNB (BNB)
$660.22 6.1
BNB price
Solana
Solana (SOL)
$89.14 5.6
Solana price
Hyperliquid
Hyperliquid (HYPE)
$72.62 4.2
Hyperliquid price
Cardano
Cardano (ADA)
$0.20778 13.4
Cardano price
Chainlink
Chainlink (LINK)
$10.89 4.5
Chainlink price
POL (ex-MATIC)
POL (ex-MATIC) (POL)
$0.083635 2.1
POL (ex-MATIC) price
Gram (prev. Toncoin)
Gram (prev. Toncoin) (GRAM)
$1.42 4.4
Gram (prev. Toncoin) price
Asteroid Shiba
Asteroid Shiba (ASTEROID)
$0.0000677 7.6
Asteroid Shiba price
Bitcoin
Bitcoin (BTC)
$74,848.00 7.8
Bitcoin price
Ethereum
Ethereum (ETH)
$2,347.02 4.5
Ethereum price
XRP
XRP (XRP)
$1.31 19.7
XRP price
BNB
BNB (BNB)
$660.22 6.1
BNB price
Solana
Solana (SOL)
$89.14 5.6
Solana price
Hyperliquid
Hyperliquid (HYPE)
$72.62 4.2
Hyperliquid price
Cardano
Cardano (ADA)
$0.20778 13.4
Cardano price
Chainlink
Chainlink (LINK)
$10.89 4.5
Chainlink price
POL (ex-MATIC)
POL (ex-MATIC) (POL)
$0.083635 2.1
POL (ex-MATIC) price
Gram (prev. Toncoin)
Gram (prev. Toncoin) (GRAM)
$1.42 4.4
Gram (prev. Toncoin) price
Asteroid Shiba
Asteroid Shiba (ASTEROID)
$0.0000677 7.6
Asteroid Shiba price
Bitcoin
Bitcoin (BTC)
$74,848.00 7.8
Bitcoin price
Ethereum
Ethereum (ETH)
$2,347.02 4.5
Ethereum price
XRP
XRP (XRP)
$1.31 19.7
XRP price
BNB
BNB (BNB)
$660.22 6.1
BNB price
Solana
Solana (SOL)
$89.14 5.6
Solana price
Hyperliquid
Hyperliquid (HYPE)
$72.62 4.2
Hyperliquid price
Cardano
Cardano (ADA)
$0.20778 13.4
Cardano price
Chainlink
Chainlink (LINK)
$10.89 4.5
Chainlink price
POL (ex-MATIC)
POL (ex-MATIC) (POL)
$0.083635 2.1
POL (ex-MATIC) price
Gram (prev. Toncoin)
Gram (prev. Toncoin) (GRAM)
$1.42 4.4
Gram (prev. Toncoin) price
Asteroid Shiba
Asteroid Shiba (ASTEROID)
$0.0000677 7.6
Asteroid Shiba price
Bitcoin
Bitcoin (BTC)
$74,848.00 7.8
Bitcoin price
Ethereum
Ethereum (ETH)
$2,347.02 4.5
Ethereum price
XRP
XRP (XRP)
$1.31 19.7
XRP price
BNB
BNB (BNB)
$660.22 6.1
BNB price
Solana
Solana (SOL)
$89.14 5.6
Solana price
Hyperliquid
Hyperliquid (HYPE)
$72.62 4.2
Hyperliquid price
Cardano
Cardano (ADA)
$0.20778 13.4
Cardano price
Chainlink
Chainlink (LINK)
$10.89 4.5
Chainlink price
POL (ex-MATIC)
POL (ex-MATIC) (POL)
$0.083635 2.1
POL (ex-MATIC) price
Gram (prev. Toncoin)
Gram (prev. Toncoin) (GRAM)
$1.42 4.4
Gram (prev. Toncoin) price
Asteroid Shiba
Asteroid Shiba (ASTEROID)
$0.0000677 7.6
Asteroid Shiba price

Ethereum price retreats below $4,000 as correction deepens

Anna Akopian
Edited by
Markets
Ethereum price chart from crypto.news showing RSI and MACD levels.

Ethereum price struggles to maintain bullish momentum, retreating below the $4,000 mark as selling pressure intensifies.

Summary
  • Ethereum price retreats below $4,000, down 5% in 24 hours and 15.5% in the past week.
  • RSI sits at 43.60, nearing oversold conditions, while the MACD shows a negative divergence, signaling continued bearish momentum.
  • Whale activity is mixed, with some investors like Bitmine buying the dip and BlackRock selling $310.13 million worth of ETH
  • Support is found at $4,000, with resistance at $4,263. A breakout above could push ETH toward $4,500 and beyond.

Ethereum has retreated below the $4,000 mark, falling to the $3,900 region as it struggles with waning investor interest and negative sentiment in the market. At the time of writing, ETH trades at $3,971, per crypto.news data.

The second-largest cryptocurrency is down roughly 5% on the daily chart and posts a15.5% loss on the weekly timeframe, signaling the ongoing bearish pressure. The latest pullback occurred after bulls attempted to break past the $4,263 resistance level. However, selling pressure at this price point triggered a correction, pushing Ethereum (ETH) lower to its current price.
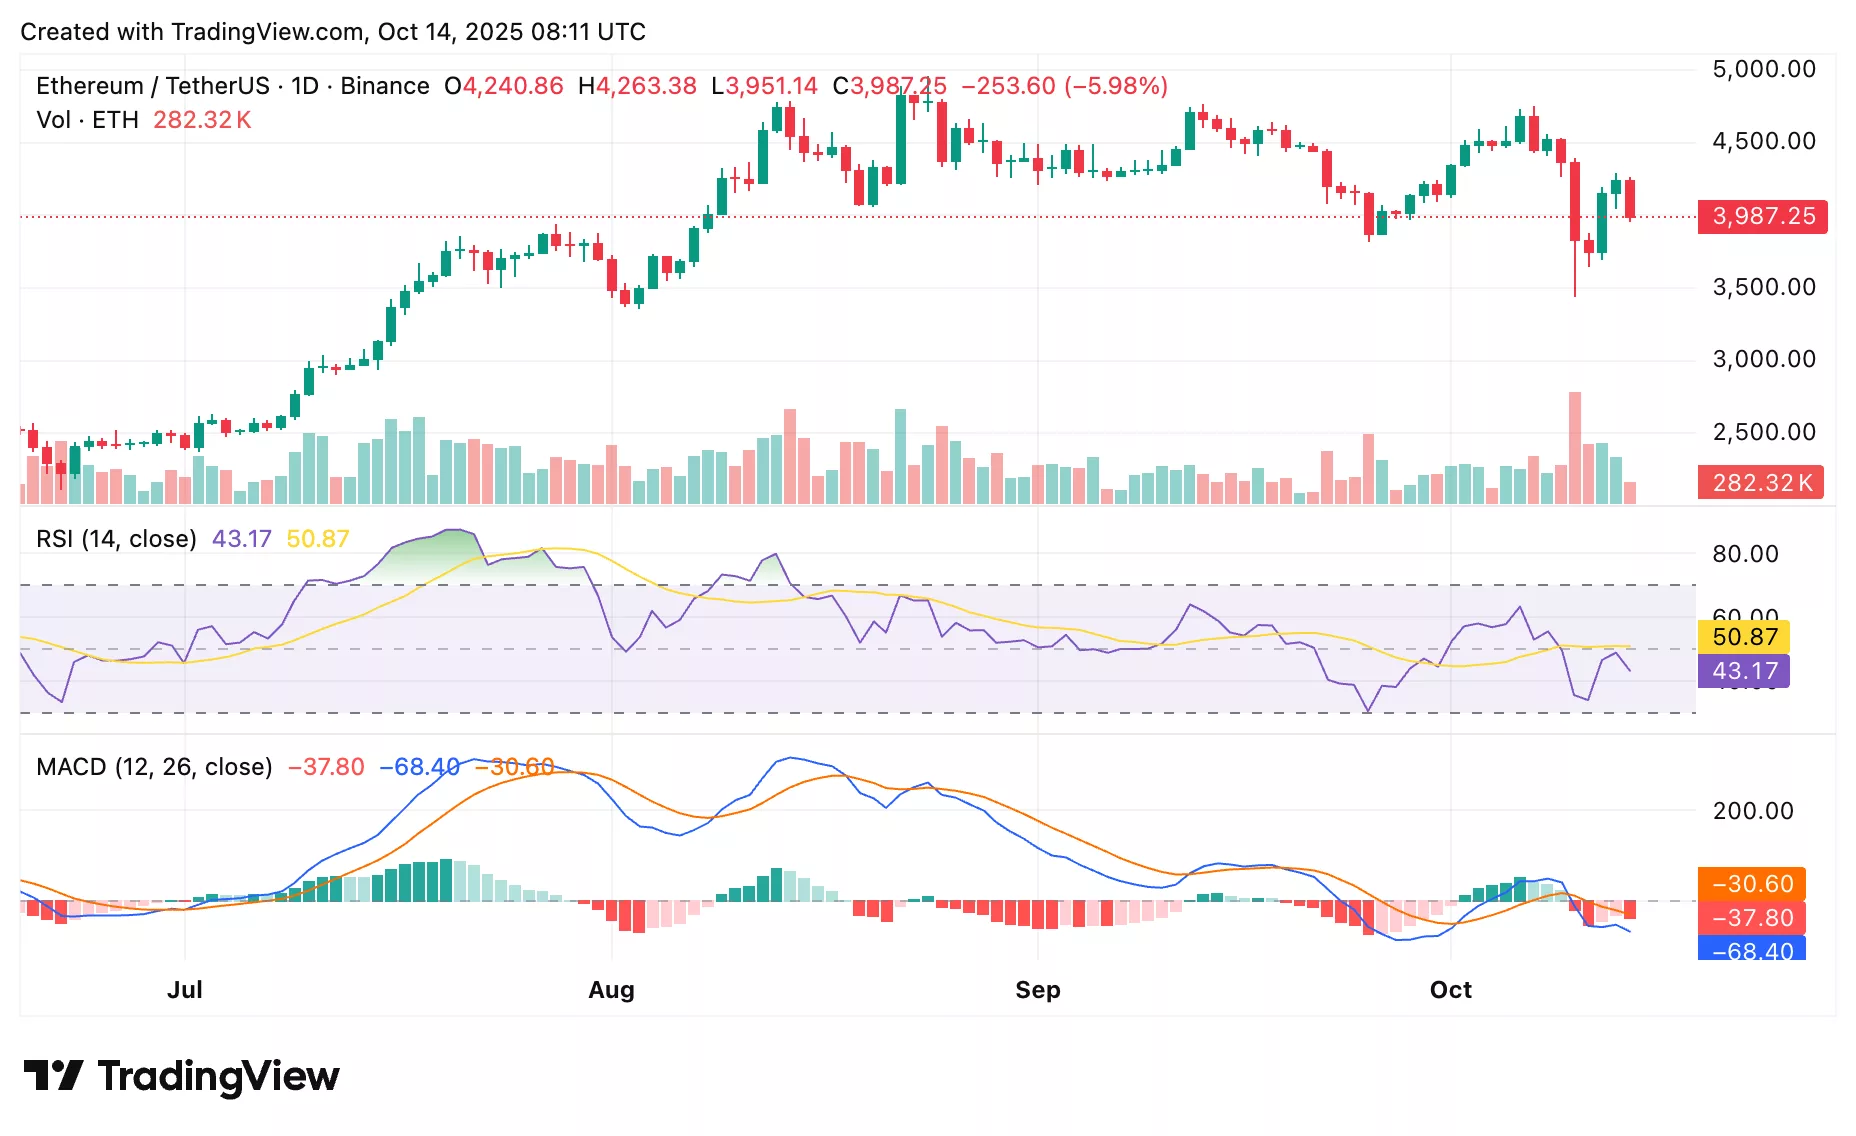
Ethereum price chart from crypto.news showing RSI and MACD levels.
ETH price chart | Source: crypto.news

Both the RSI and MACD indicators are showing signs of weakening momentum. The RSI currently sits at 43.60, approaching the oversold zone, which could indicate that selling pressure is nearing its peak. However, with the RSI still in neutral territory, further declines remain a possibility. 

The MACD also shows a negative divergence, with the short-term momentum line (blue) positioned well below the long-term momentum line (orange), signaling the potential for a continued downtrend if momentum does not shift soon.

Ethereum price fall affects whale activity 

The ongoing Ethereum price downtrend is being followed by a mix of selling and buying interest from whale investors. On October 13, Ethereum spot ETFs recorded a net outflow of $428.52 million, marking the third consecutive day of outflows. 

Notably, BlackRock’s ETHA fund accounted for $310.13 million of the outflow. Despite this, some investors, like Tom Lee’s Bitmine, have been taking advantage of the dip, accumulating $834 million worth of ETH over the past week.

Ethereum’s price has found support around the $4,000 mark, which could act as a psychological support zone. A break below this level could see Ethereum test lower levels, potentially around $3,965. On the upside, resistance remains at $4,263. If ETH can break this level, a rally to $4,500 or even $4,750 could follow.