

Bitcoin
Bitcoin (BTC)
$81,359.00 1.24%
Bitcoin price
Ethereum
Ethereum (ETH)
$2,357.19 1.26%
Ethereum price
XRP
XRP (XRP)
$1.30 -0.69%
XRP price
BNB
BNB (BNB)
$748.89 0.18%
BNB price
Solana
Solana (SOL)
$101.97 1.14%
Solana price
Hyperliquid
Hyperliquid (HYPE)
$95.80 19.67%
Hyperliquid price
Cardano
Cardano (ADA)
$0.205646 2.05%
Cardano price
Chainlink
Chainlink (LINK)
$11.86 3.09%
Chainlink price
POL (ex-MATIC)
POL (ex-MATIC) (POL)
$0.092304 0.92%
POL (ex-MATIC) price
Gram (prev. Toncoin)
Gram (prev. Toncoin) (GRAM)
$1.23 -0.05%
Gram (prev. Toncoin) price
Pons
Pons (PONS)
$0.276948 -2.95%

How high can Pepe price get if Ethereum surges to $5,000?

Jayson Derrick
Edited by
Markets
How high can Pepe price get if Ethereum surges to $5,000?

Pepe coin has entered a bear market this year after plunging 65% from its all-time high.

Pepe (PEPE), the second-biggest Ethereum (ETH) meme coin after Shiba Inu (SHIB), has plunged to the key support at $0.000010.

While its decline aligns with the broader crypto sell-off, it is also influenced by Ethereum’s ongoing underperformance.

Ethereum, the largest layer-1 blockchain, has lagged behind other major blockchains like Bitcoin and Solana. It has fallen by 5% over the past 12 months, while Bitcoin and Solana have surged by over 70%.

Ethereum has also lost market share in several sectors, including decentralized finance, meme coins, and non-fungible tokens. This trend has impacted many Ethereum-based tokens, which have underperformed as investors shift their focus to assets within the Solana ecosystem.

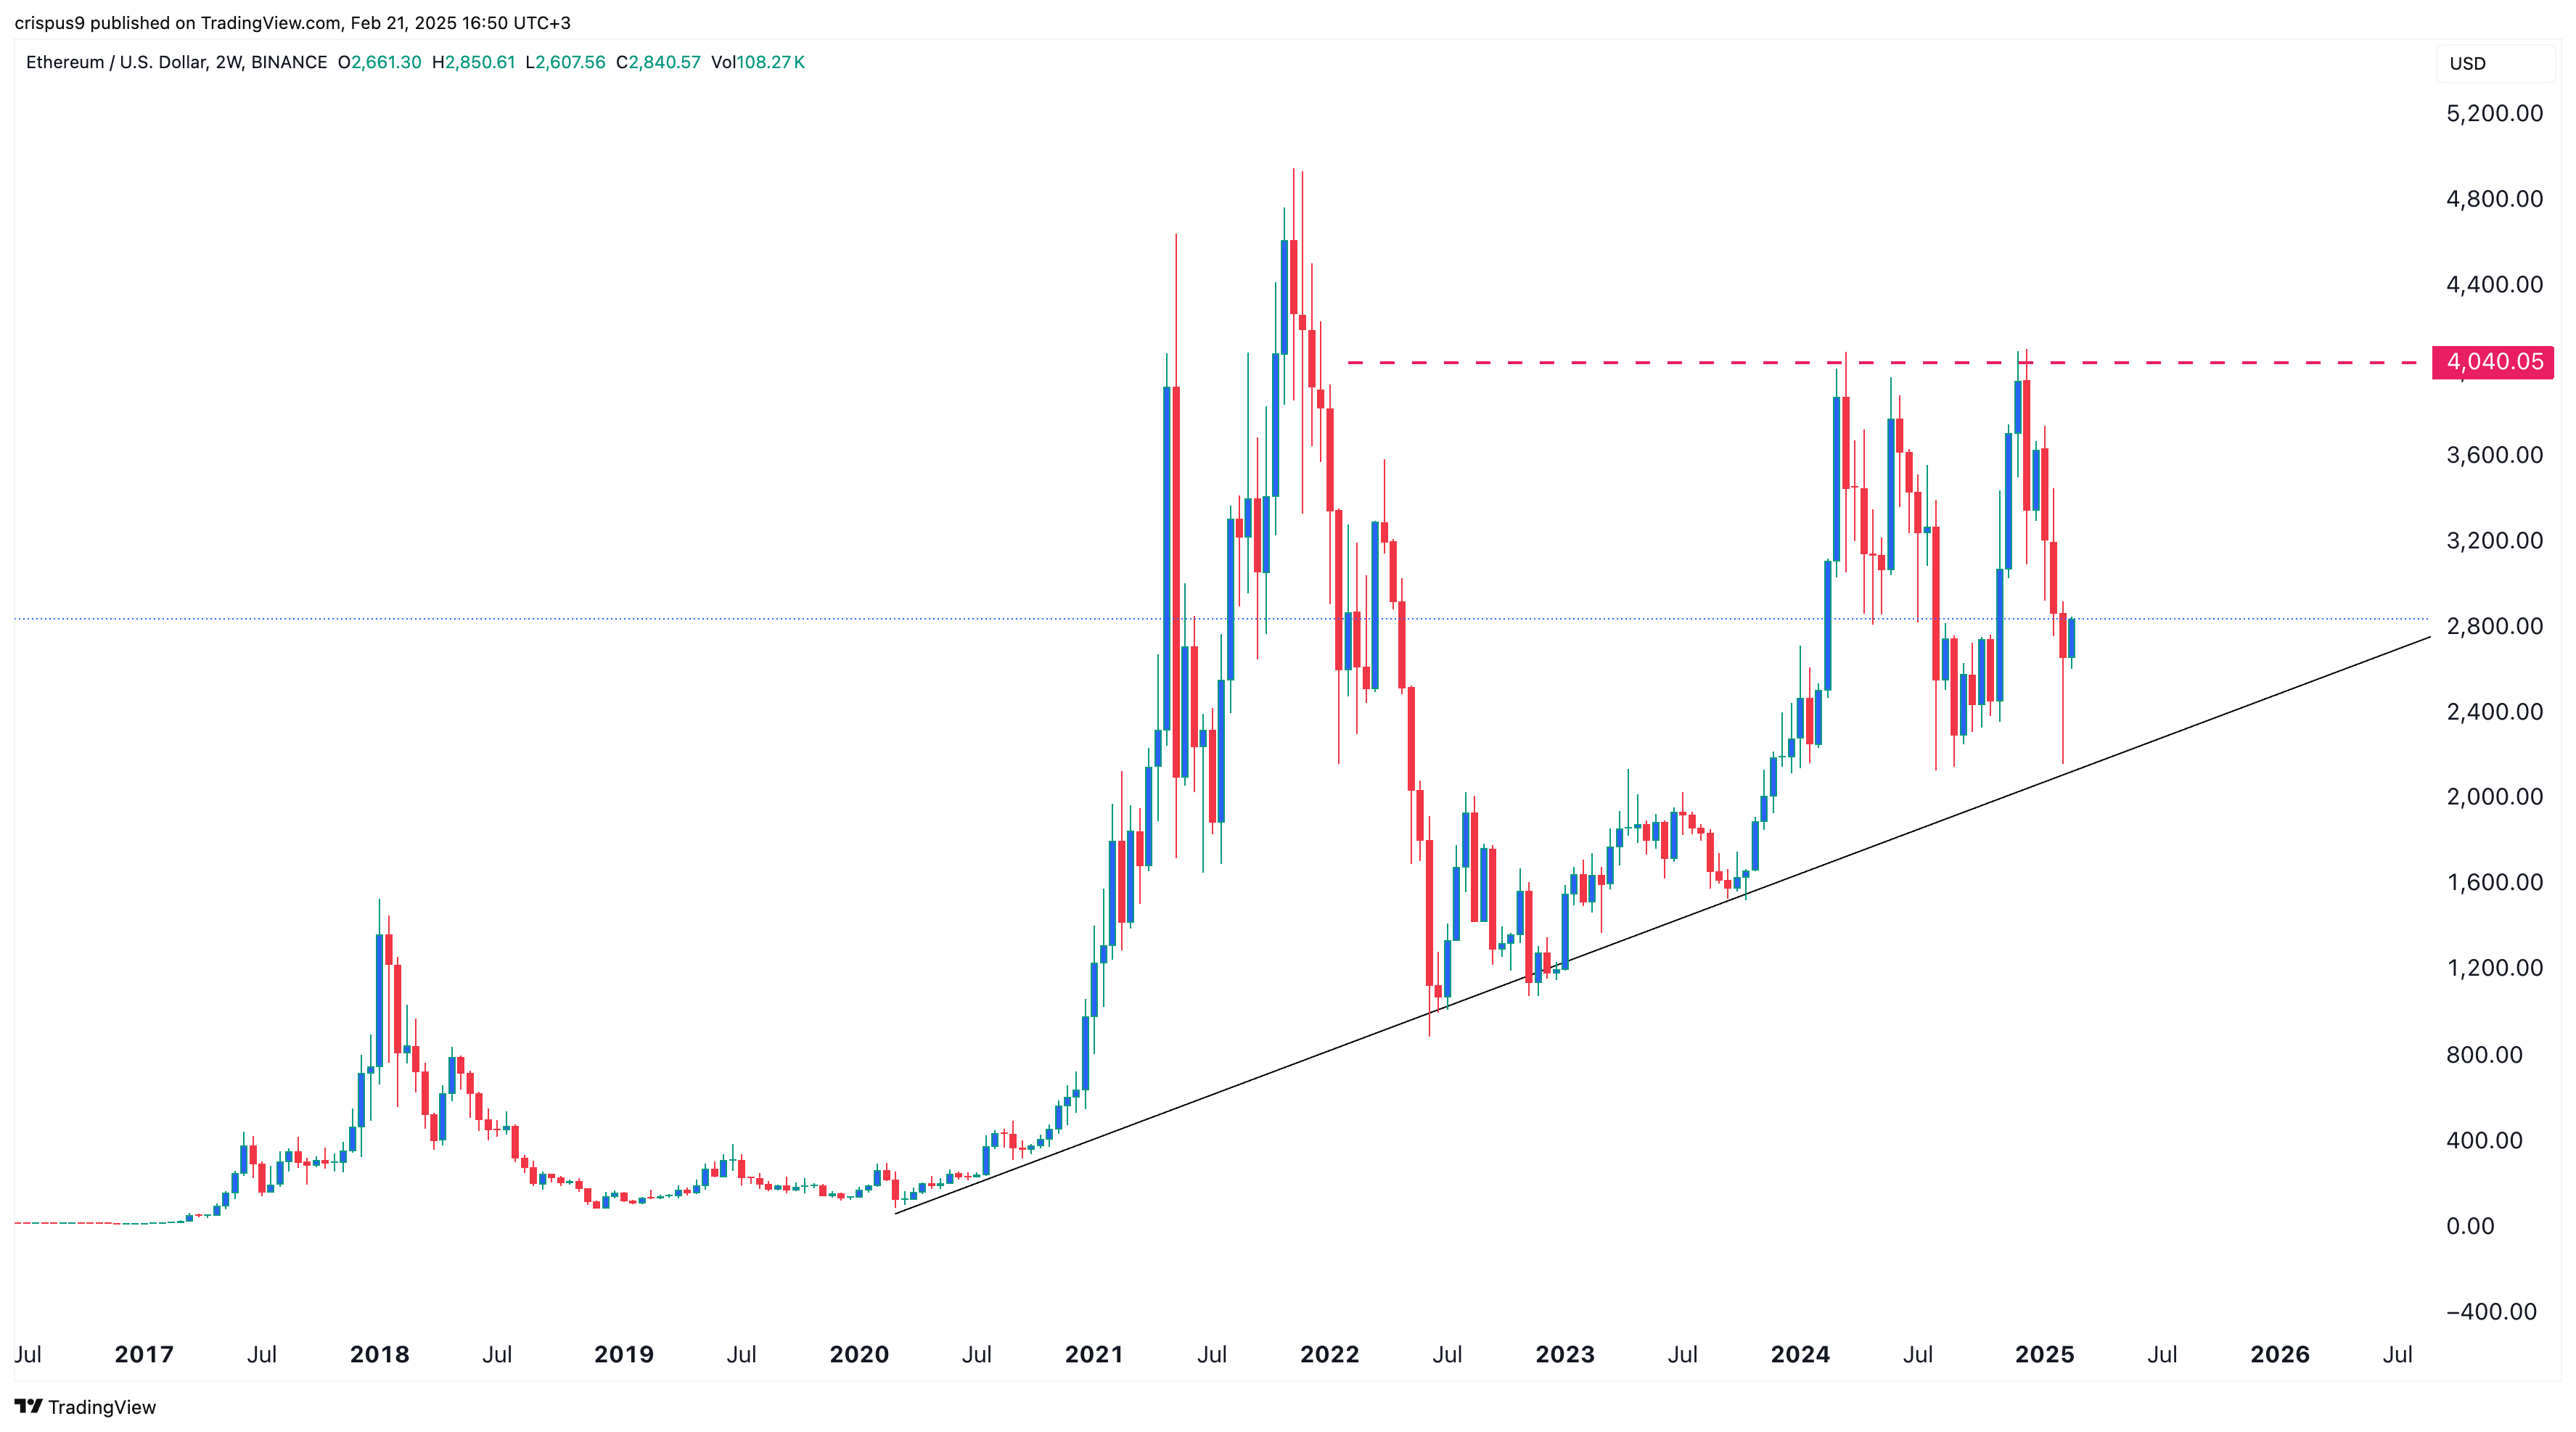
Ethereum is likely to surge to $4,000, as the coin has formed an ascending triangle pattern on the two-week chart. This pattern is characterized by a horizontal resistance level and a diagonal trendline composed of higher highs and higher lows.

A strong bullish breakout will be confirmed if Ethereum surpasses the $4,000 resistance level. A sustained breakout above this price could increase the likelihood of Ether reaching $5,000 in the long term.
Ethereum price
Ethereum price chart | Source: crypto.news

Pepe price technical analysis

A strong Ethereum price breakout may also lift Pepe and other Ethereum-based tokens. The daily chart suggests that Pepe is positioning for a significant bullish breakout.

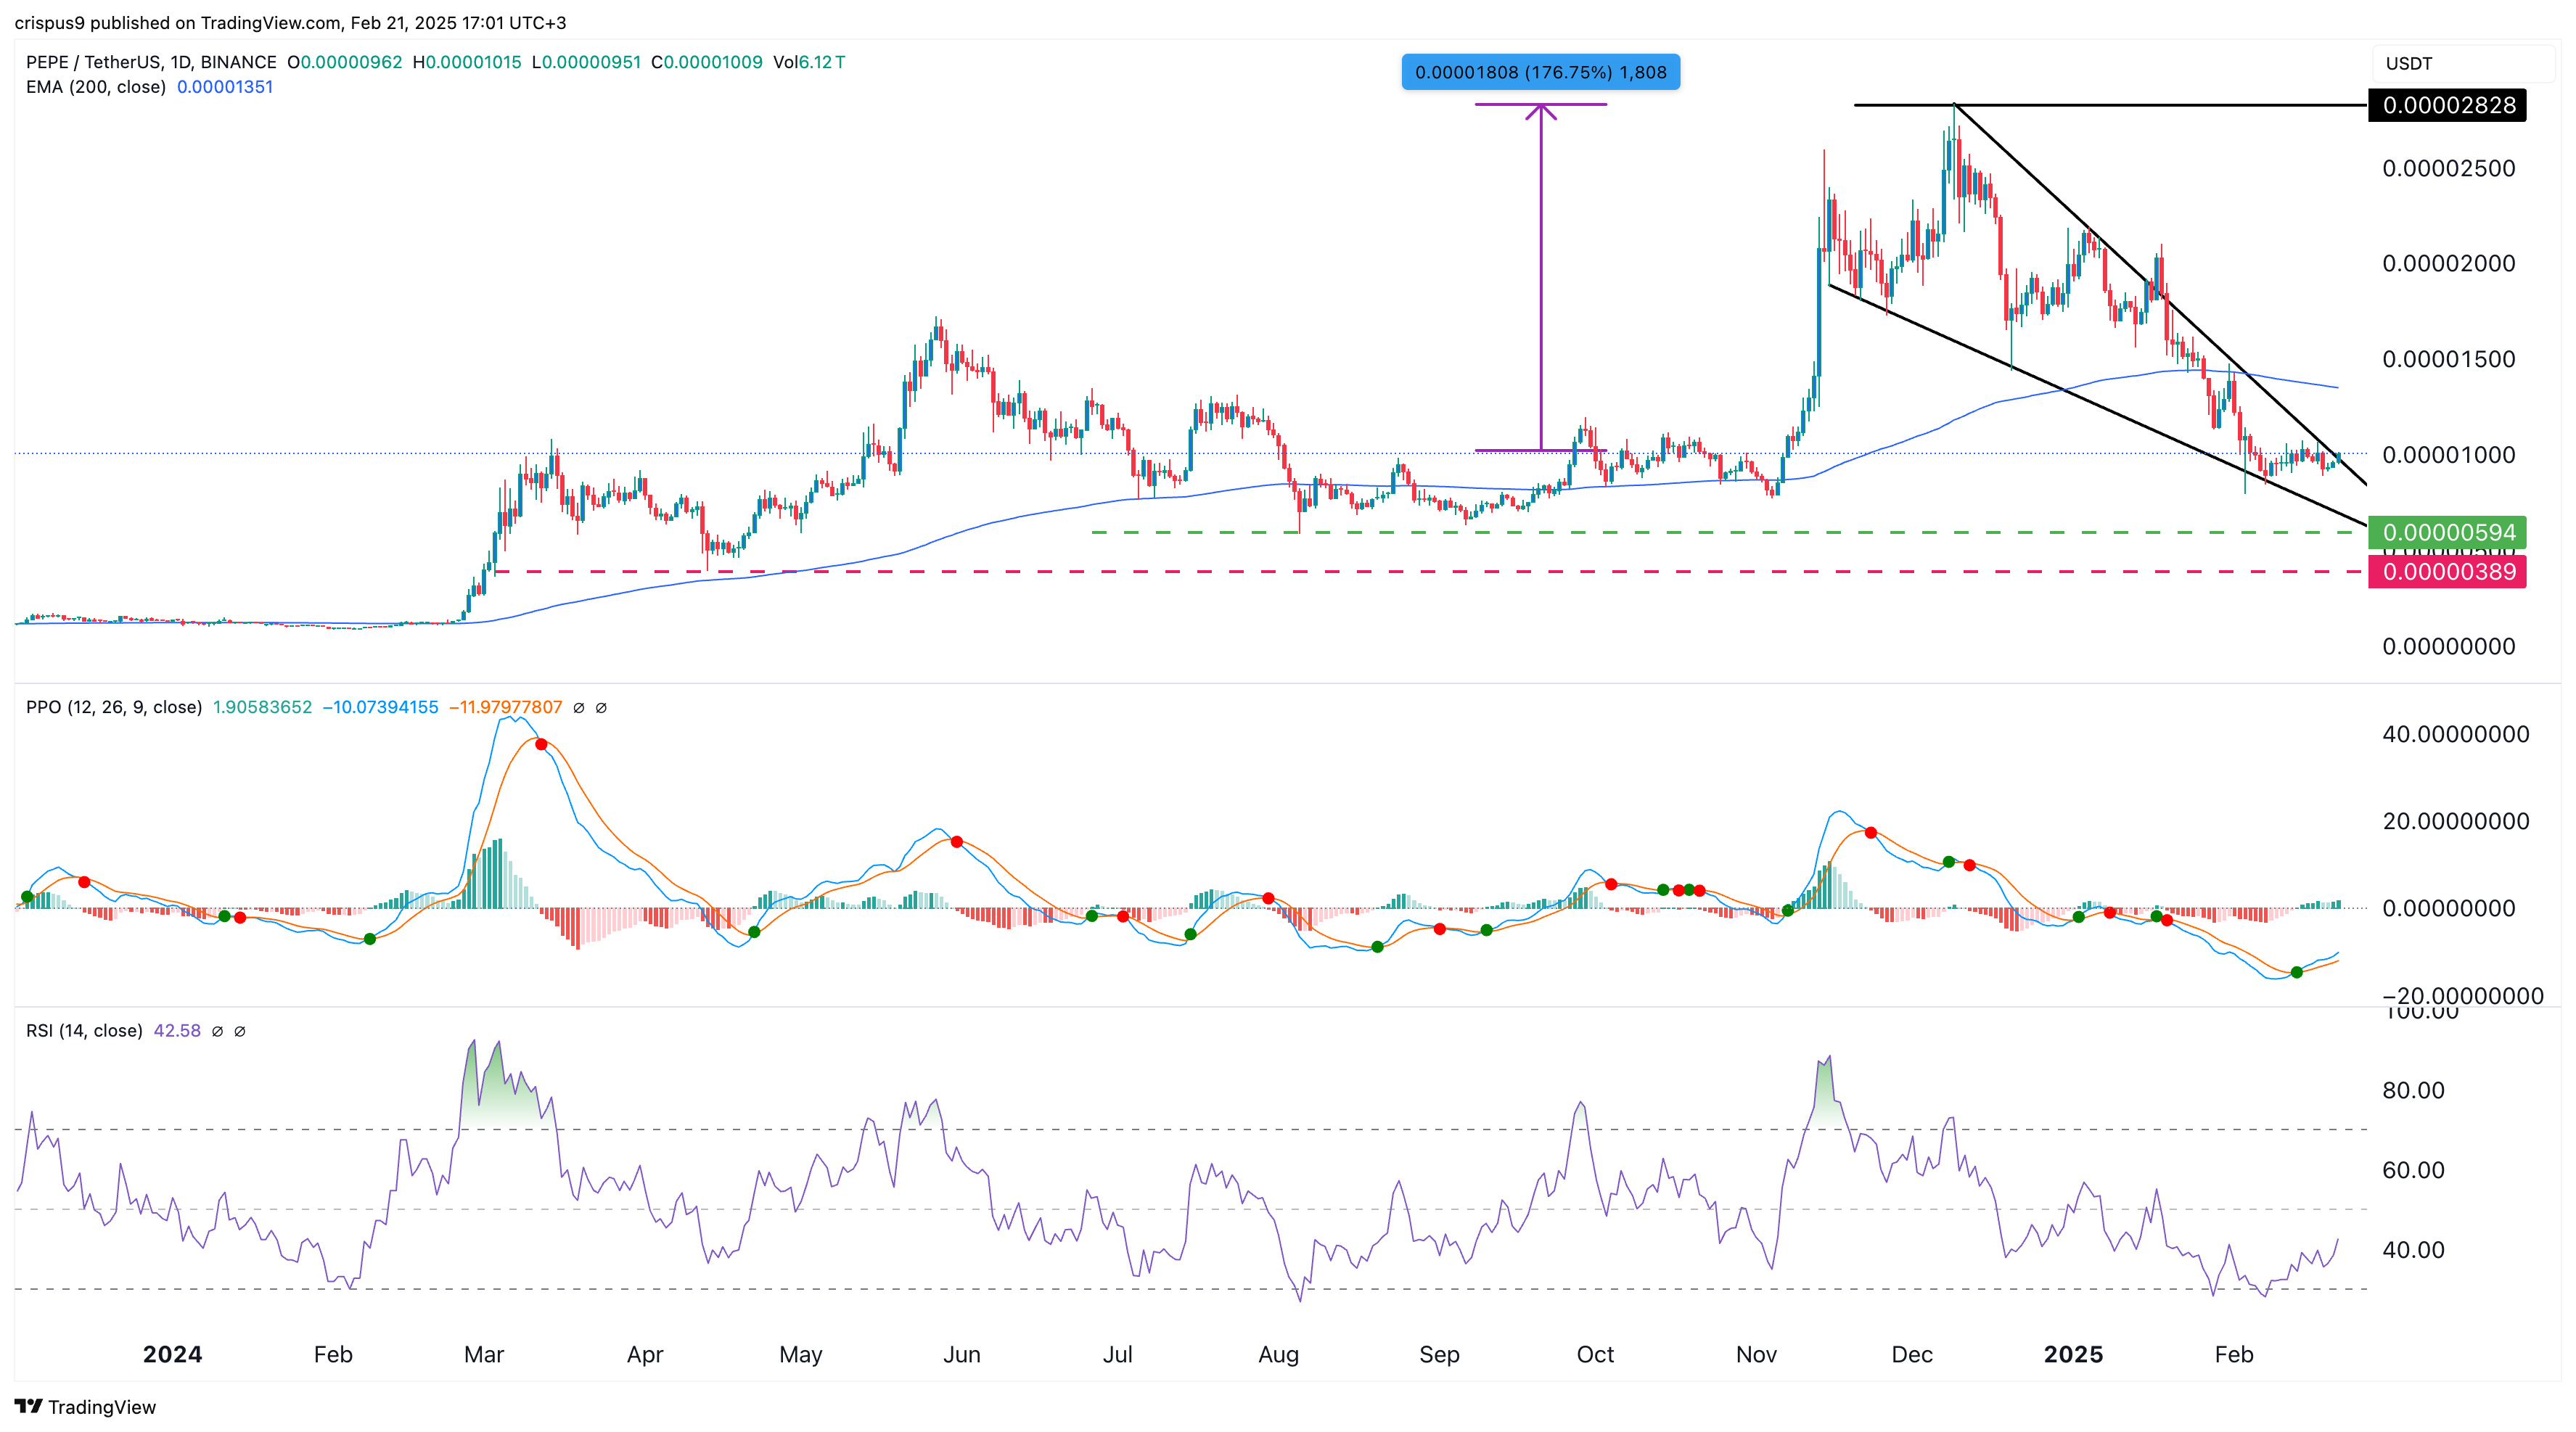
Oscillators such as the Percentage Price Oscillator and the Relative Strength Index have started forming a bullish divergence pattern. This divergence occurs when these oscillators trend upward while the asset’s price remains in a downtrend.

At the same time, Pepe is forming a bearish divergence pattern, which consists of two converging downward trendlines. These lines are approaching their confluence level, a point where bullish breakouts often occur.
Pepe price
Pepe price chart | Source: crypto.news

The first key level to watch for Pepe is the 200-day moving average at $0.00001351, which represents a 35% increase from its current price. Further gains could push Pepe toward its all-time high of $0.000028, marking a 175% surge.

However, if Ethereum continues to weaken, Pepe could decline further, initially to $0.0000060 and then to $0.0000038, levels that marked its lowest swings in August and April last year.