Bitcoin
Bitcoin (BTC)
$61,528.00 1.29809
Bitcoin price
Ethereum
Ethereum (ETH)
$1,705.97 4.58352
Ethereum price
XRP
XRP (XRP)
$1.09 2.69461
XRP price
BNB
BNB (BNB)
$560.47 1.32291
BNB price
Solana
Solana (SOL)
$80.62 3.19857
Solana price
Hyperliquid
Hyperliquid (HYPE)
$67.03 5.35476
Hyperliquid price
Cardano
Cardano (ADA)
$0.163327 5.24551
Cardano price
Chainlink
Chainlink (LINK)
$7.73 3.05654
Chainlink price
POL (ex-MATIC)
POL (ex-MATIC) (POL)
$0.073083 1.64093
POL (ex-MATIC) price
Gram (prev. Toncoin)
Gram (prev. Toncoin) (GRAM)
$1.64 5.2577
Gram (prev. Toncoin) price
Asteroid Shiba
Asteroid Shiba (ASTEROID)
$0.0000709 -2.47044
Asteroid Shiba price

Is the IBIT stock a buy as the BlackRock Bitcoin ETF loses traction?

Jayson Derrick
Edited by
Markets
Is the IBIT stock a buy as the BlackRock Bitcoin ETF loses traction?

The iShares Bitcoin Trust stock pulled back to a crucial support level as Bitcoin price lost momentum.

Summary
  • The IBIT ETF has pulled back this month, mirroring the performance of Bitcoin.
  • A technical analysis on Bitcoin points to an eventual IBIT rebound.
  • BTC has formed a bullish flag and a break-and-retest pattern.

The IBIT ETF retreated to a low of $63.80 this week, down 8.40% from its highest point this year. It remains about 51% above its lowest level in 2025.

SoSoValue data shows the fund has lost momentum in terms of inflows. It recorded a net outflow of $77 million on Tuesday, bringing total net assets to $83.8 billion. Since inception, cumulative inflows have reached $57 billion.

IBIT has become the most successful ETF ever, with total assets peaking above $86 billion in July. It is also BlackRock’s eighth-largest and most profitable ETF.

Other spot Bitcoin (BTC) ETFs have also lost traction this month. They recorded outflows of $196 million on Tuesday, bringing total outflows to over $1.4 billion.

Is the IBIT stock a good buy today?

The IBIT ETF moves in sync with the performance of Bitcoin. As such, the best way to predict its trajectory is to analyze Bitcoin price action.

Bitcoin price
Bitcoin price chart | Source: crypto.news

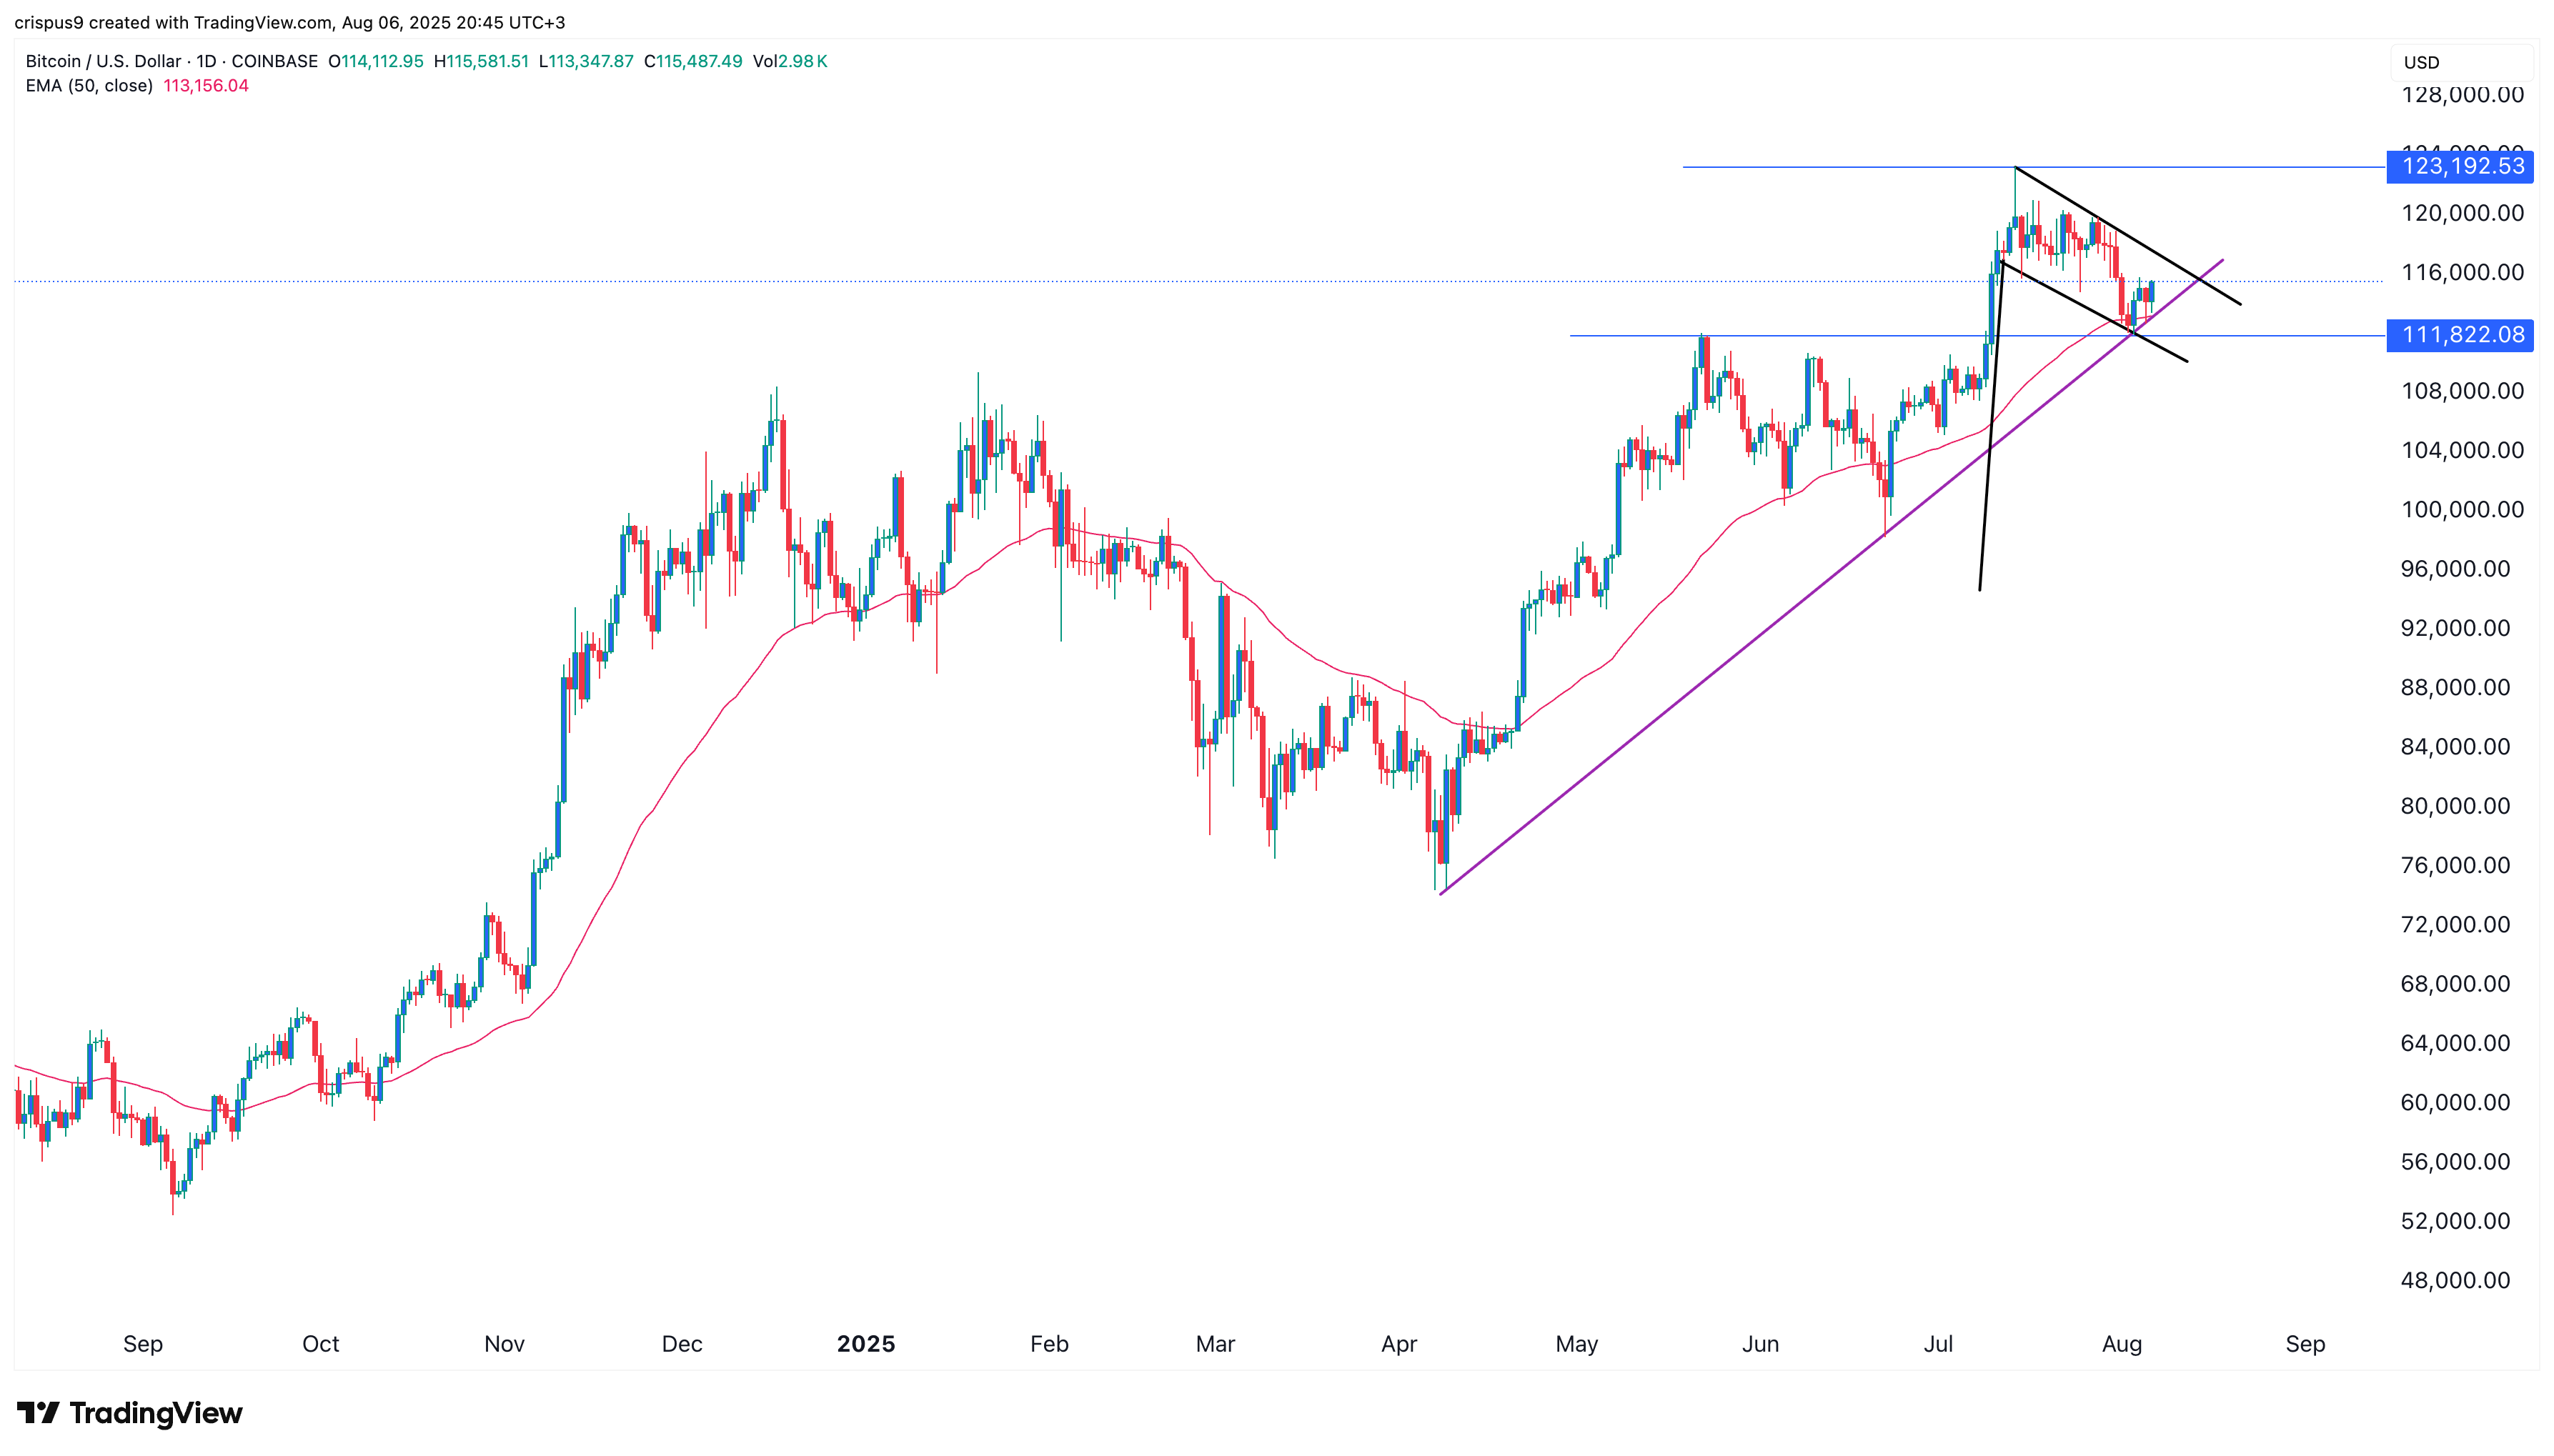
The daily chart above shows that Bitcoin price has pulled back since July 14. It dropped from a high of $123,192 to a low of $112,000, its highest swing on May 23rd.

Bitcoin has formed a bullish flag pattern, a common continuation signal. This pattern consists of a vertical rally followed by a descending channel and often leads to a breakout.

BTC has also completed a break-and-retest pattern, moving back to $112,000, a key support level. This type of retest is often seen as a signal of trend continuation.

Additionally, Bitcoin has done a mean reversion by declining to the 50-day Exponential Moving Average. It has also retested the ascending trendline connecting the lows since April.

Therefore, the most likely scenario is a rebound toward the all-time high of $123,192. A break above that level would confirm a bullish breakout and potentially push BTC to $125,000. If this plays out, the IBIT ETF is also expected to rebound, as it closely tracks Bitcoin’s price.