Bitcoin
Bitcoin (BTC)
$60,215.00 -2.79185
Bitcoin price
Ethereum
Ethereum (ETH)
$3,294.43 -3.61842
Ethereum price
BNB
BNB (BNB)
$556.93 -3.73754
BNB price
Solana
Solana (SOL)
$140.76 -8.57923
Solana price
XRP
XRP (XRP)
$0.4667670 -3.58286
XRP price
Shiba Inu
Shiba Inu (SHIB)
$0.0000163 -5.07167
Shiba Inu price
Pepe
Pepe (PEPE)
$0.0000102 -9.6802
Pepe price
Bonk
Bonk (BONK)
$0.0000219 -13.62726
Bonk price

Popular crypto analyst reveals forecast for Coinbase shares

popular-crypto-analyst-reveals-forecast-for-coinbase-shares
Edited by
News
Popular crypto analyst reveals forecast for Coinbase shares

Peter Brandt is bullish on Coinbase.

The investing savant shared his opinion on X that Coinbase shares have nowhere to go but up.

Brandt identified an inverted head and shoulders pattern on the Coinbase stock chart, a significant indicator in technical analysis.

This pattern, emerging after a period of downtrend, is characterized by three distinct troughs: the central trough, or the head, is the most pronounced, while the two adjacent troughs, referred to as shoulders, are comparatively shallower. This formation is often interpreted as a potential signal for a reversal in market trends, suggesting a possible upward trajectory for Coinbase’s stock in the near future.

Coinbase became the first crypto exchange to achieve public status in the United States. The company began trading shares on Nasdaq via a direct listing in Feb. 2021 opening at $430.

By May 2022, shares of the crypto exchange fell to $40. At the time of writing, Coinbase’s stock price is trading at $128.27, according to TradingView.
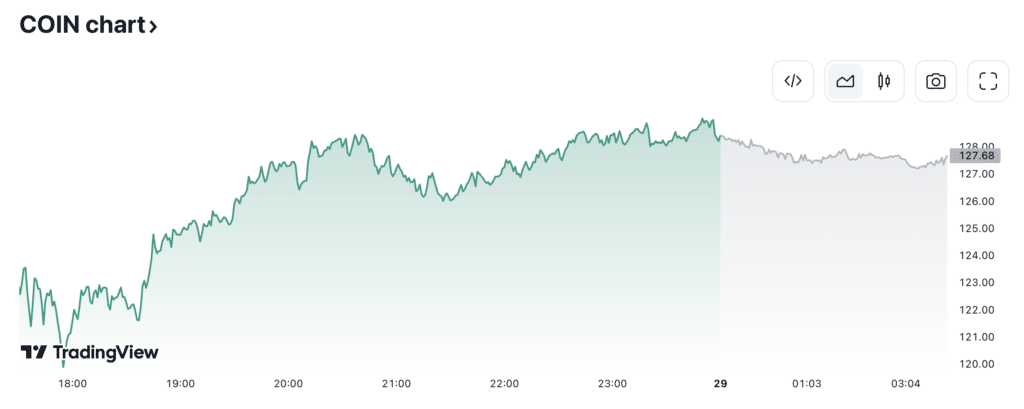
Popular crypto analyst reveals forecast for Coinbase shares - 1
Source: TradingView

Coinbase shares began to show positive dynamics in the fall of 2023 amid the overall growth of the digital asset market. The main drivers of industry growth were expectations for the approval of the first spot Bitcoin ETF in US history and the approaching Bitcoin (BTC) halving 2024. Both events could lead the market into a new growth cycle.

However, Coinbase remains under the radar of the US Securities and Exchange Commission (SEC). In June 2023, the regulator sued the trading platform. SEC officials accuse Coinbase of hiding information, operating without registration, and other violations.