Ripple price could form a golden cross as ETF hopes rise

Ripple price rose to a crucial resistance level as the company’s chief executive speculated on potential spot exchange-traded funds.
Ripple’s (XRP) token rose 6% on Wednesday and retested the key resistance point at $0.6378, its highest point this month.
Ripple CEO on XRP ETF
In an interview with Bloomberg, Brad Garlinghouse welcomed the recent spot ETFs by the Securities and Exchange Commission.
The agency approved the spot Bitcoin (BTC) ETFs in January, which attracted over $17 billion in assets under management. On Tuesday, it gave its go-ahead to spot Ethereum (ETH) ETFs.
Garlinghouse also expressed optimism that the SEC would receive more token applications and that XRP would be one of them. He answered vaguely about whether he had talked with BlackRock about an XRP fund.
Additionally, the CEO says he sees ETFs based on baskets as a way to diversify risks. For example, an ETF could track the top ten biggest cryptocurrencies, while another concept would be for a fund that tracks the biggest layer-1 tokens.
A case for a Ripple ETF can be made since it is the sixth biggest cryptocurrency in the world after Bitcoin, Ethereum, Tether, BNB, and Solana (SOL). Its market cap is over $35 billion.
Last summer, before the SEC filed to dismiss its lawsuit against Ripple, the judge overseeing the case noted that XRP was not a security when sold to retail investors. XRP is also a highly liquid cryptocurrency with a daily volume of over $1.5 billion.
In addition to Ripple, Solana, Chainlink, and Cardano are other cryptocurrencies that could attract the attention of ETF issuers.
Ripple price tests key level
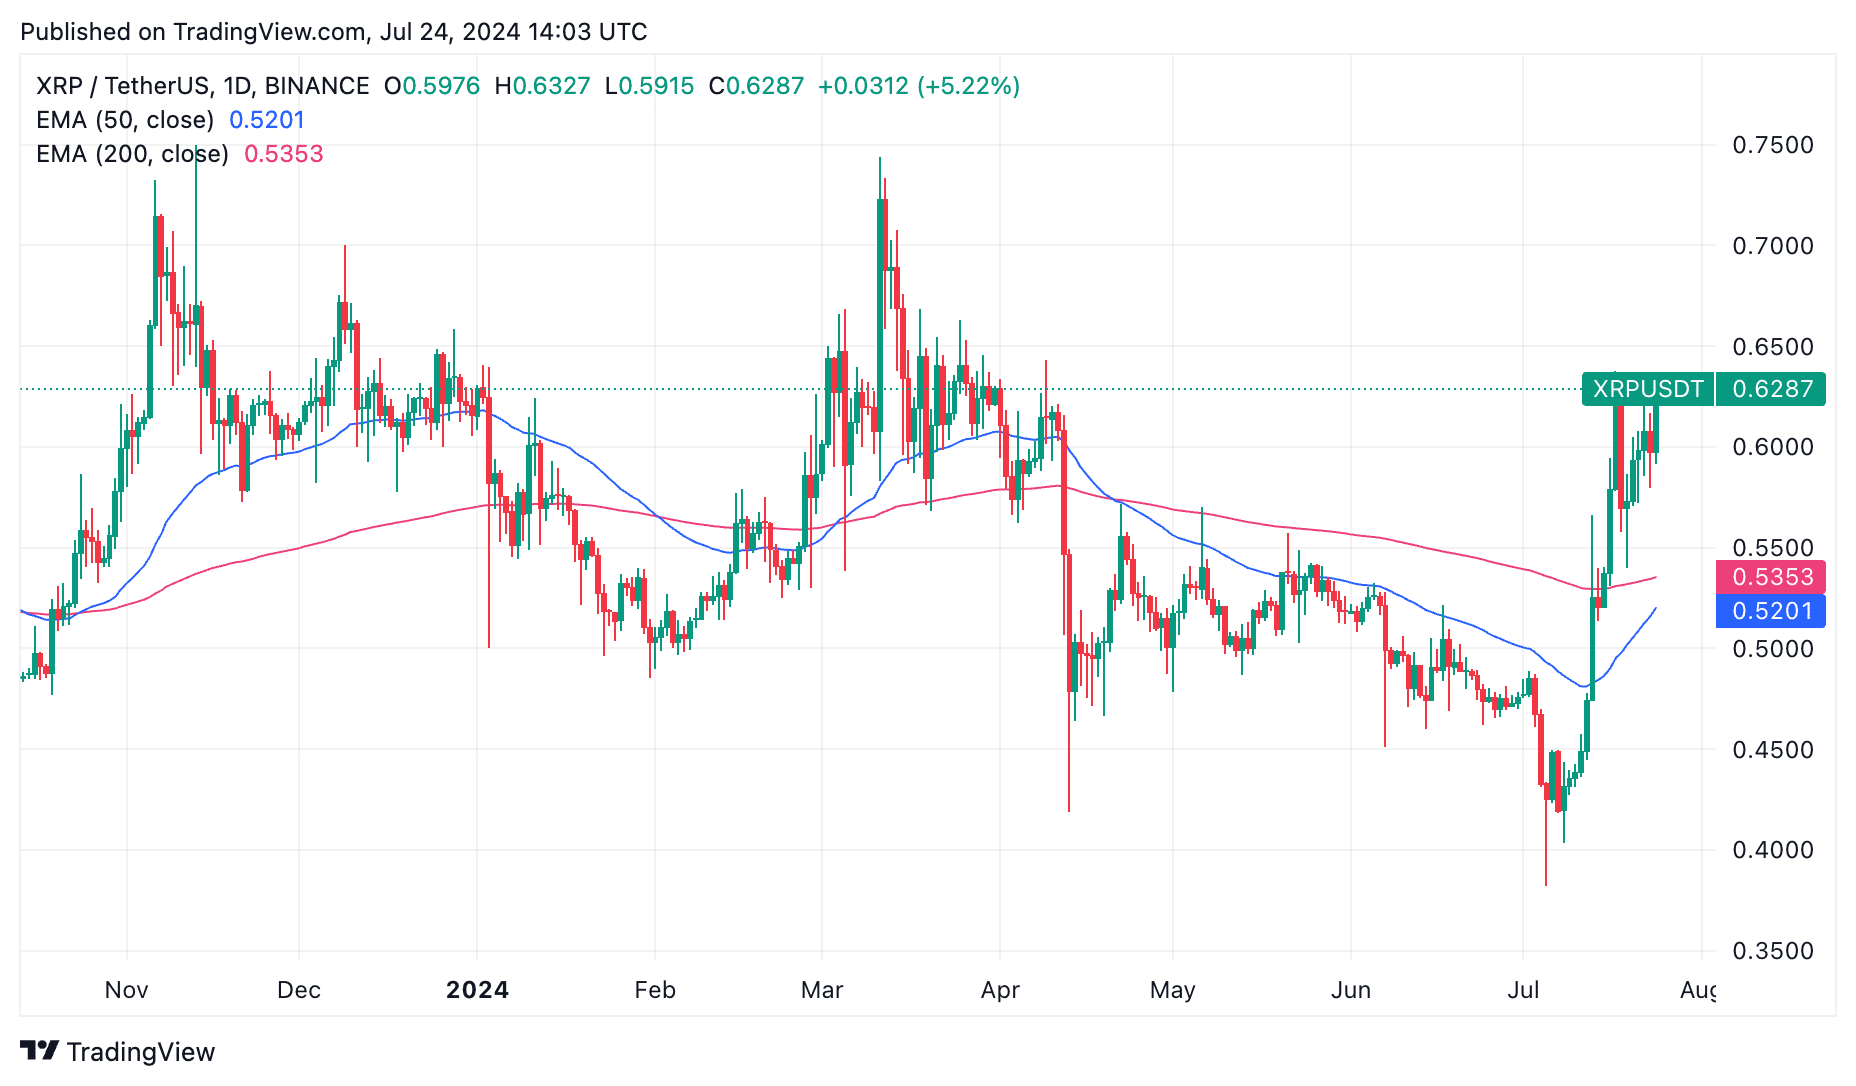
Meanwhile, XRP’s price has risen to an important support level that could determine the next action. $0.63.78 is a crucial level since it was the highest level this month. Technically, the token needs to move above this level to invalidate the double-top pattern, a popular bearish reversal sign.
Additionally, XRP is about to form a golden cross pattern where the 200-day and 50-day moving averages cross each other. In most periods, this pattern leads to more upside. The last time it happened in October 2023, it led to a 44% increase.


