Bitcoin
Bitcoin (BTC)
$79,466.00 1.43032
Bitcoin price
Ethereum
Ethereum (ETH)
$2,505.10 1.35811
Ethereum price
XRP
XRP (XRP)
$1.43 2.61529
XRP price
BNB
BNB (BNB)
$750.13 -0.16487
BNB price
Solana
Solana (SOL)
$104.43 1.40676
Solana price
Hyperliquid
Hyperliquid (HYPE)
$86.88 4.45662
Hyperliquid price
Cardano
Cardano (ADA)
$0.221045 1.37308
Cardano price
Chainlink
Chainlink (LINK)
$12.20 -2.69197
Chainlink price
POL (ex-MATIC)
POL (ex-MATIC) (POL)
$0.098233 1.74644
POL (ex-MATIC) price
Gram (prev. Toncoin)
Gram (prev. Toncoin) (GRAM)
$1.40 0.58469
Gram (prev. Toncoin) price
Bitcoin
Bitcoin (BTC)
$79,466.00 1.43032
Bitcoin price
Ethereum
Ethereum (ETH)
$2,505.10 1.35811
Ethereum price
XRP
XRP (XRP)
$1.43 2.61529
XRP price
BNB
BNB (BNB)
$750.13 -0.16487
BNB price
Solana
Solana (SOL)
$104.43 1.40676
Solana price
Hyperliquid
Hyperliquid (HYPE)
$86.88 4.45662
Hyperliquid price
Cardano
Cardano (ADA)
$0.221045 1.37308
Cardano price
Chainlink
Chainlink (LINK)
$12.20 -2.69197
Chainlink price
POL (ex-MATIC)
POL (ex-MATIC) (POL)
$0.098233 1.74644
POL (ex-MATIC) price
Gram (prev. Toncoin)
Gram (prev. Toncoin) (GRAM)
$1.40 0.58469
Gram (prev. Toncoin) price
Bitcoin
Bitcoin (BTC)
$79,466.00 1.43032
Bitcoin price
Ethereum
Ethereum (ETH)
$2,505.10 1.35811
Ethereum price
XRP
XRP (XRP)
$1.43 2.61529
XRP price
BNB
BNB (BNB)
$750.13 -0.16487
BNB price
Solana
Solana (SOL)
$104.43 1.40676
Solana price
Hyperliquid
Hyperliquid (HYPE)
$86.88 4.45662
Hyperliquid price
Cardano
Cardano (ADA)
$0.221045 1.37308
Cardano price
Chainlink
Chainlink (LINK)
$12.20 -2.69197
Chainlink price
POL (ex-MATIC)
POL (ex-MATIC) (POL)
$0.098233 1.74644
POL (ex-MATIC) price
Gram (prev. Toncoin)
Gram (prev. Toncoin) (GRAM)
$1.40 0.58469
Gram (prev. Toncoin) price
Bitcoin
Bitcoin (BTC)
$79,466.00 1.43032
Bitcoin price
Ethereum
Ethereum (ETH)
$2,505.10 1.35811
Ethereum price
XRP
XRP (XRP)
$1.43 2.61529
XRP price
BNB
BNB (BNB)
$750.13 -0.16487
BNB price
Solana
Solana (SOL)
$104.43 1.40676
Solana price
Hyperliquid
Hyperliquid (HYPE)
$86.88 4.45662
Hyperliquid price
Cardano
Cardano (ADA)
$0.221045 1.37308
Cardano price
Chainlink
Chainlink (LINK)
$12.20 -2.69197
Chainlink price
POL (ex-MATIC)
POL (ex-MATIC) (POL)
$0.098233 1.74644
POL (ex-MATIC) price
Gram (prev. Toncoin)
Gram (prev. Toncoin) (GRAM)
$1.40 0.58469
Gram (prev. Toncoin) price

SATS recovers 104%, but double top formation threatens steep correction

Dorian Batycka
Edited by
Markets
SATS recovers 104%, but double top formation threatens steep correction

The latest Ordinals rebound leads to the potential formation of a bearish double top, a pattern that could signal the start of a steep retracement journey for the cryptocurrency.

SATS (SATS) has staged an impressive recovery since hitting a one-month low of $0.000001540 during the Black Monday event on Aug. 5. 

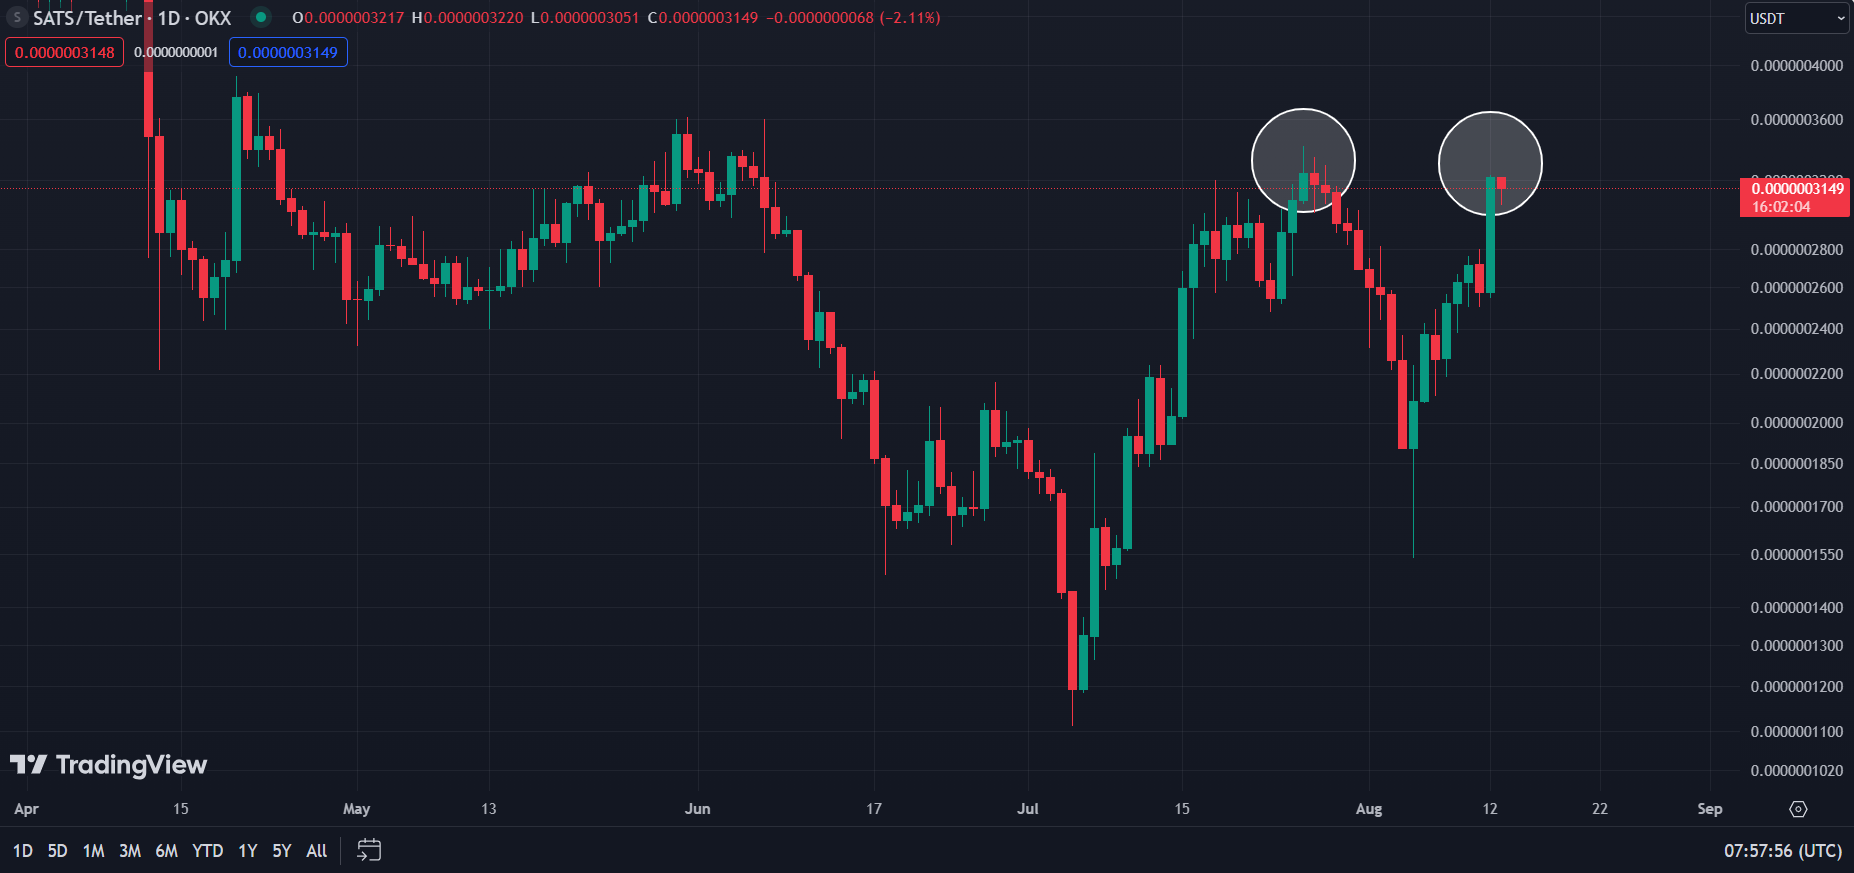
The digital asset has recorded double-digit intraday gains on three occasions since the sharp dip. The most significant rally occurred on Aug. 12, when SATS surged by 24.79%, lifting its price to a new monthly peak of $0.000003232. 

SATS recovers 104%, but double top formation threatens steep correction - 3

SATS double-top indicator – Aug. 13 | Source: Trading View

Despite a 2% drop this morning, SATS has defended the support around the $0.0000031 psychological mark. The asset is trading at $0.000003148 at the time of writing, representing an impressive 104% gain from the Aug. 5 floor price.

However, the bullish push appears to be running into resistance. The potential formation of a double-top pattern on the daily chart adds to this bearish outlook. Ordinals formed the first top when it surged to $0.000003418 on July 26. The second top formed amid the recent spike to $0.000003232.

The double top formation would be confirmed if the asset’s recent drop persists toward the neckline at the $0.00000154 support. SATS would have to fervently defend the $0.000001988 territory to hedge against any drops to this neckline.
SATS recovers 104%, but double top formation threatens steep correction - 4
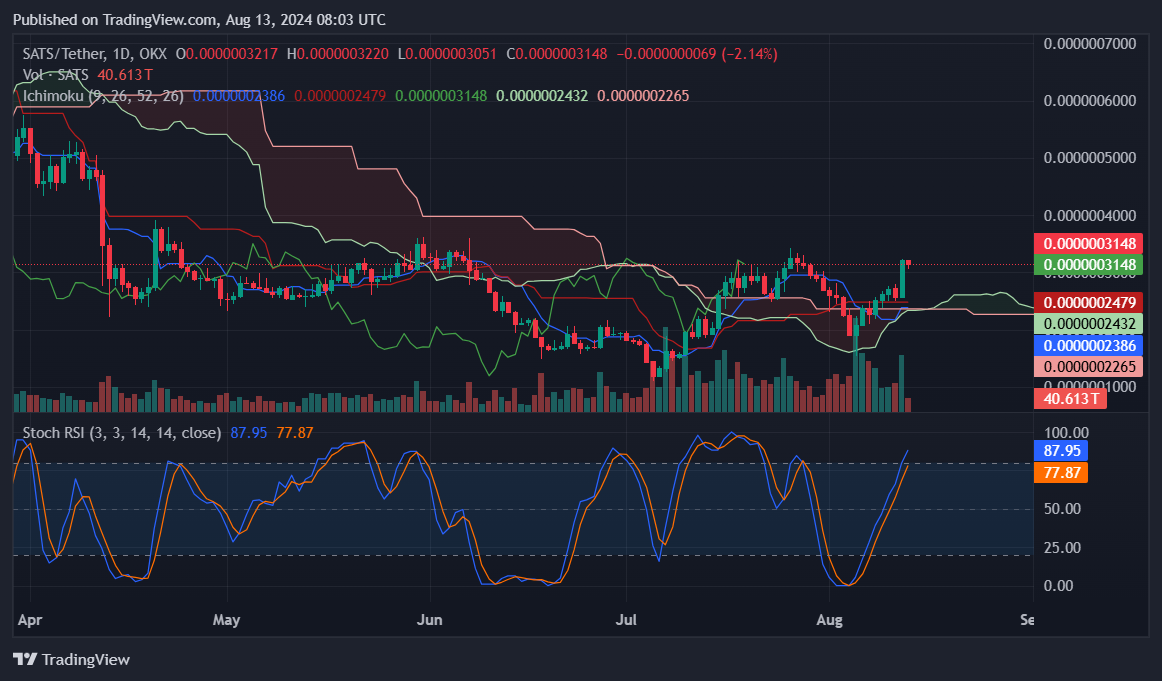
SATS 1D chart – Aug. 13 | Source: crypto.news

Meanwhile, the Stochastic RSI indicator is currently in overbought territory. The %K line stands at 87.95, while the %D line is at 77.87. Both lines being above and near 80 typically indicate that the asset is overbought and could be due for a price correction. 

In addition, the Ichimoku Cloud indicates that the conversion line (blue) is below the baseline (red), a bearish signal that indicates the possibility of a downward trend. 

Despite this, the latest upsurge has kept SATS above the cloud, confirming the prevalence of bullish momentum. Amid the ongoing drop, the bulls need to hold above $0.000002880 to sustain the bullish trend.