Solana price retreats from $100 after rejection, will upcoming SMA crossover trigger rebound?


Solana price pulled back on Monday after facing rejection near the key $100 psychological level, though traders continue watching a potentially bullish moving average crossover that could support another upside attempt.
- Solana price pulled back toward $95 after facing rejection near the key $100 psychological resistance zone.
- SOL continues trading above its 20-day, 50-day, and 100-day SMAs, with a bullish crossover now approaching.
- A breakout above $100 could open the door toward the $112–$115 region, while $85 remains key support.
According to data from crypto.news, Solana (SOL) traded around $95 at press time on May 12 after briefly climbing as high as $97.6 earlier in the session. The token remains up sharply from its April lows near $80 despite the latest rejection from the upper resistance zone.
The recent cooldown comes as broader crypto market sentiment weakened following Bitcoin’s retreat below the $82,000 level amid rising geopolitical uncertainty tied to renewed U.S.-Iran tensions. Risk appetite across altcoins also softened after investors began locking in profits from last week’s rally.
Despite the pullback, Solana continues to show signs of improving technical structure after reclaiming several important moving averages over the past two weeks.
Market sentiment around the Solana ecosystem has also remained relatively stable as on-chain activity gradually recovers. While decentralized application volumes remain below peak levels seen earlier this year, network usage and validator participation have stopped deteriorating at the same pace witnessed during the first quarter correction.
At the same time, derivatives positioning has started improving modestly, with futures activity stabilizing after weeks of subdued participation. Traders now appear focused on whether Solana can establish support above the mid-$90 region before another breakout attempt toward $100.
Solana price analysis
On the daily chart, Solana recently broke above the important resistance cluster near $92 before rallying toward the $97–$100 region, where sellers quickly stepped back in.
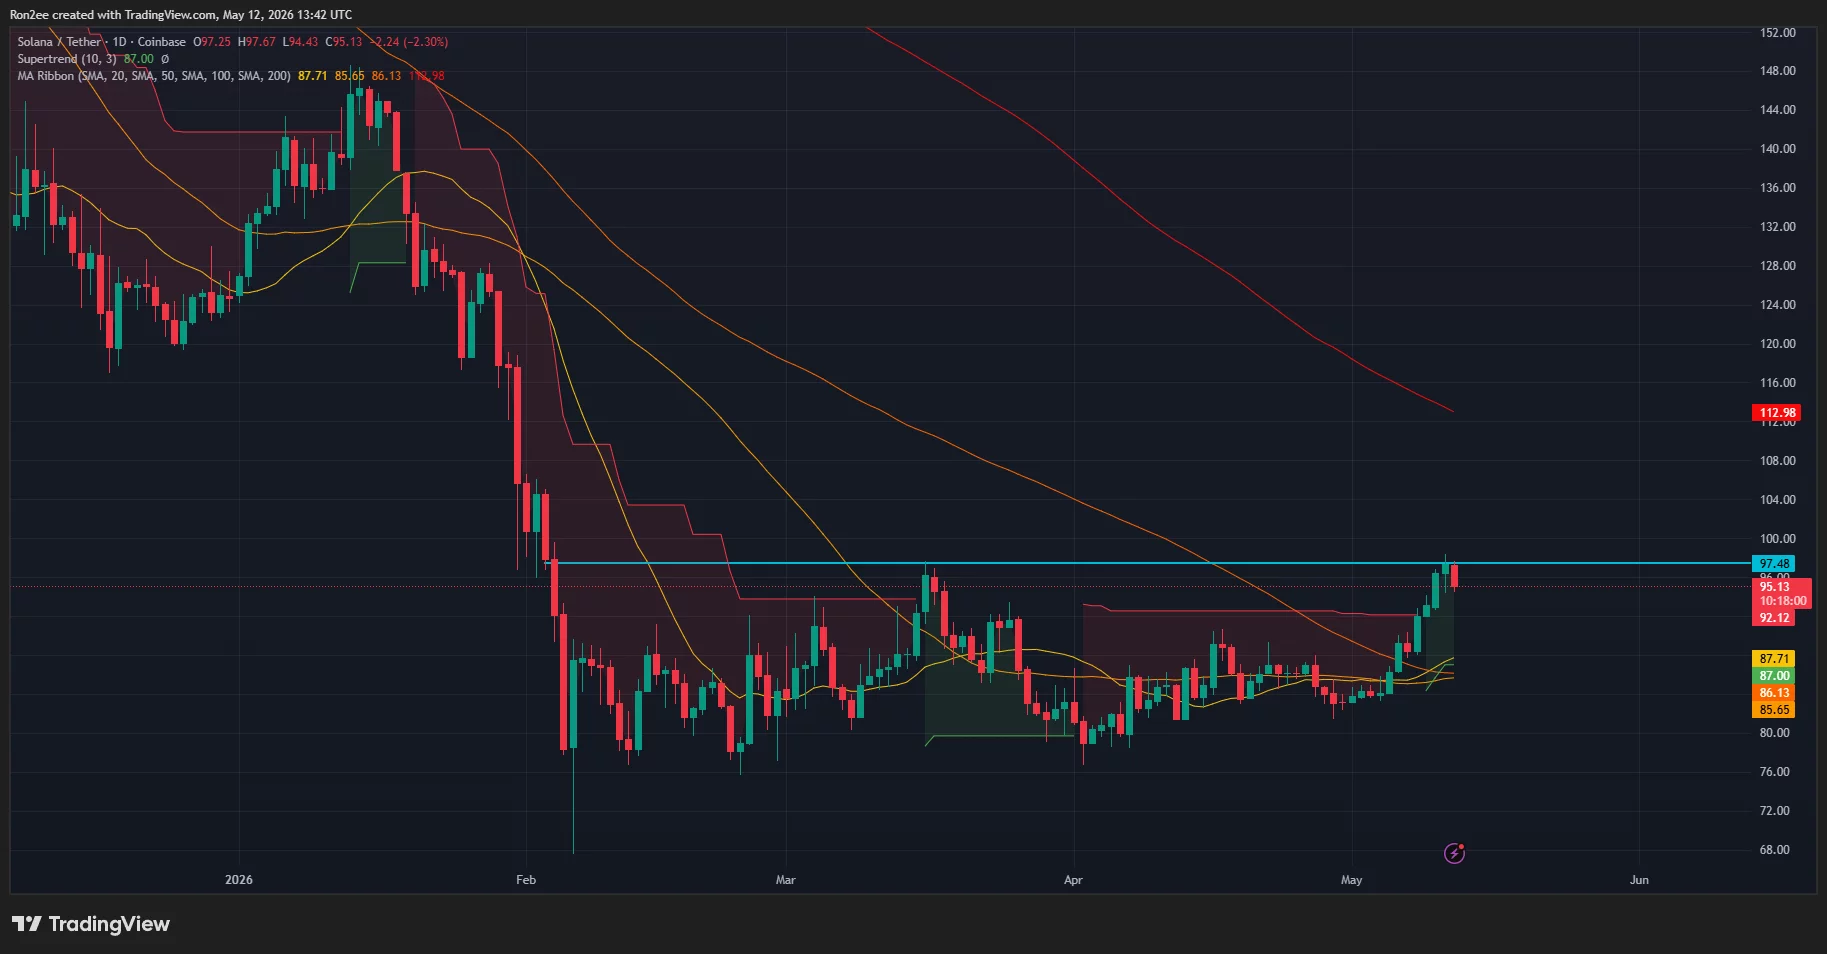
However, the broader structure still appears constructive as SOL continues trading above its 20-day, 50-day, and 100-day simple moving averages, which are now tightly compressed between roughly $85 and $88. The close convergence between these moving averages often signals that momentum is preparing for a larger directional move.
Notably, the 20-day SMA is now approaching a bullish crossover above the 50-day SMA, which could strengthen short-term bullish momentum if confirmed over the coming sessions.
The Supertrend indicator has also flipped green for the first time since January, suggesting that buyers may gradually be regaining broader trend control after months of bearish pressure.
Still, the higher timeframe trend remains somewhat cautious as Solana continues trading below its downward-sloping 200-day SMA near the $113 region, which remains a major long-term resistance barrier overhead.
If bulls manage to reclaim momentum and push above the recent high near $97, the next major upside target could emerge at the psychological $100 level. A successful breakout above that region may then open the door toward the $112–$115 resistance area near the 200-day SMA.
On the downside, failure to hold above the moving average cluster near $85–$88 could weaken the bullish setup and potentially trigger a pullback toward the $80 support region, where buyers previously stepped in aggressively.
Disclosure: This article does not represent investment advice. The content and materials featured on this page are for educational purposes only.