Solana price risks another leg lower if $70 support fails


Solana has fallen more than 6% from its June 15 high after a rejection at a major resistance zone, combined with a hawkish Federal Reserve outlook, pushed traders into risk-off positioning.
- Solana fell more than 6% after failing to reclaim the key $75–$76 resistance zone and amid Fed-driven risk-off sentiment.
- CoinGlass data shows major liquidation clusters between $74 and $76, while support is concentrated near $65–$66.
- A break below $70 could expose June lows around $62, with the $60 area emerging as the next major downside target.
According to data from crypto.news, Solana (SOL) dropped from a recent peak of $75.60 to an intraday low of $70.70 on June 18 before stabilizing near $71. The decline followed a sharp recovery from early June lows around $62, where SOL had rallied more than 20% alongside a broader rebound across the crypto market.
The selling accelerated after the Federal Reserve kept interest rates unchanged at 3.50%–3.75% while warning that inflation risks remain elevated. Policymakers also projected the possibility of additional tightening in 2026, prompting traders to reduce exposure to high-beta assets.
Bitcoin retreated toward $64,000 following the announcement, while several large-cap altcoins posted steeper losses.
Oil markets added another layer of uncertainty. Although reports of a preliminary U.S.-Iran agreement helped crude prices retreat from recent highs, traders continued to assess whether geopolitical tensions and inflation pressures could keep monetary policy restrictive for longer than previously expected.
Solana price faces resistance at former support as liquidation risks build
The daily chart shows SOL rejecting a major resistance area between $75 and $76, a zone that previously acted as structural support before June’s breakdown. After failing to reclaim that level, price slipped back below the 61.8% Fibonacci retracement near $74.80 and now trades just above the 78.6% retracement level around $68.40.
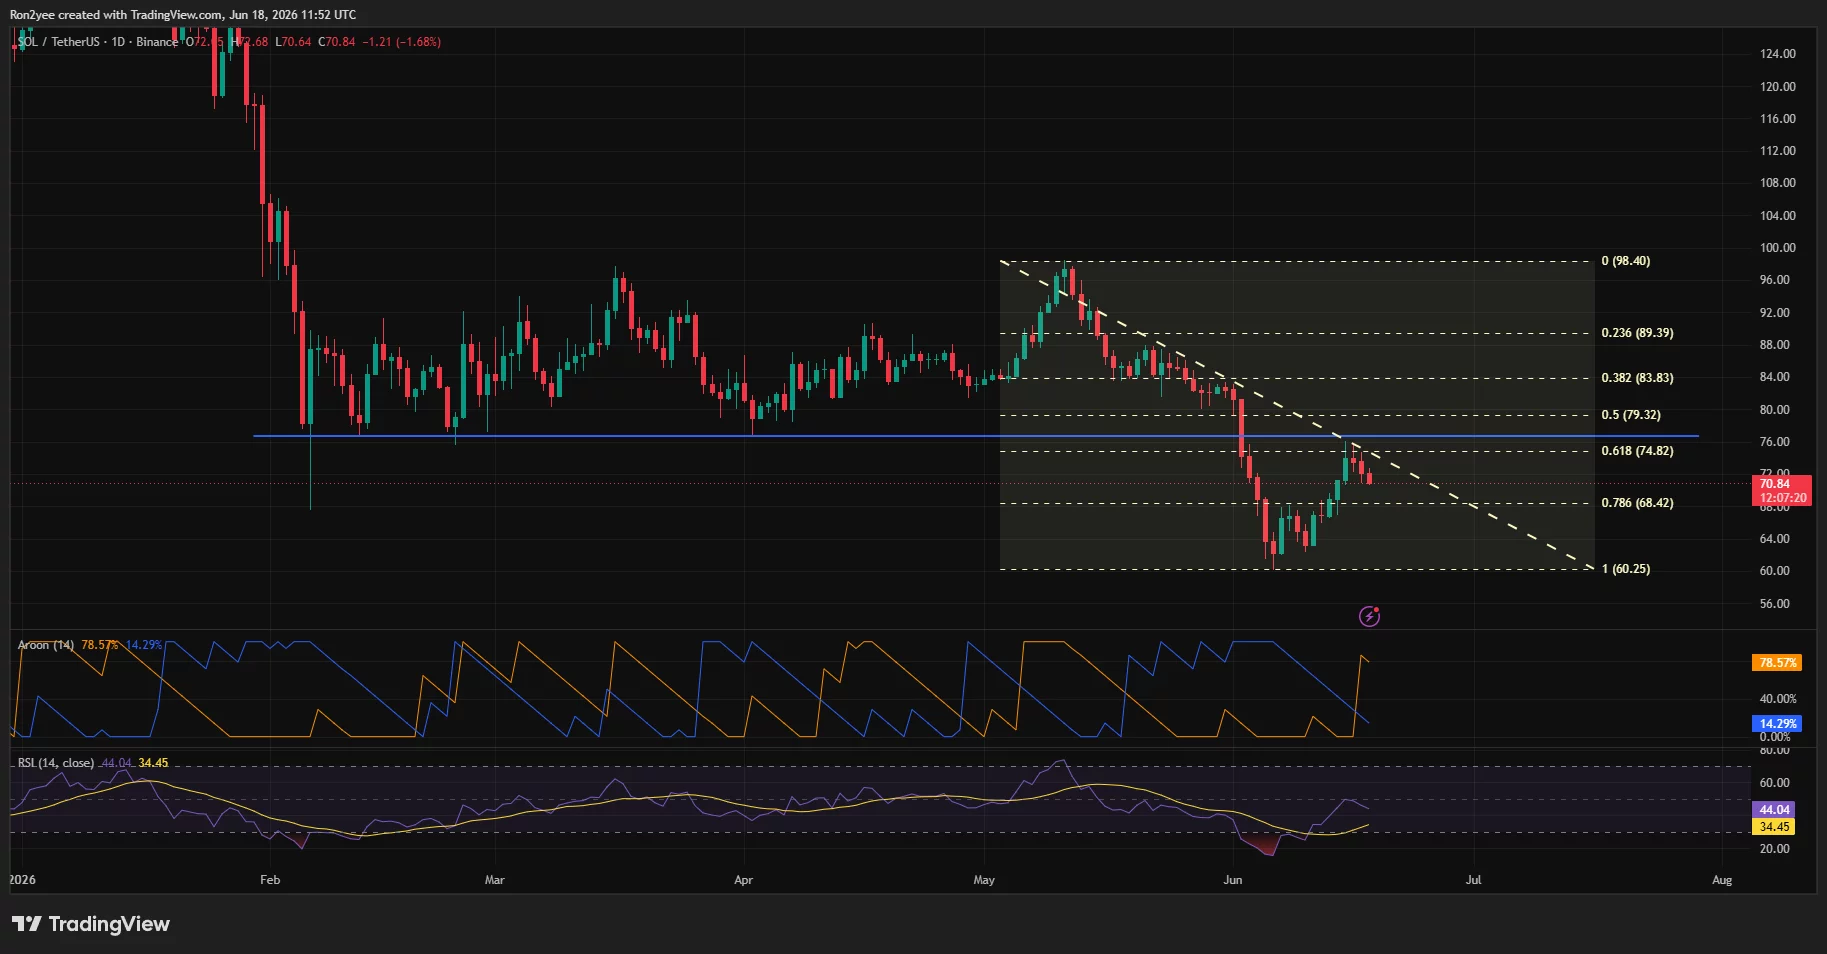
A descending trendline connecting the May and June highs remains intact, preserving the short-term bearish structure. A daily close above that trendline would expose resistance levels near $74.80 and $79.30, while a successful breakout could open the path toward the 50% retracement level near $79 and eventually the $84 area.
Momentum indicators remain mixed. The Relative Strength Index has recovered from oversold territory but remains below the neutral 50 mark, suggesting buyers have yet to regain full control. Meanwhile, the Aroon indicator continues to favor the bears, with the Aroon Down reading holding significantly above Aroon Up.
Commenting on the setup, market commentator BATMAN noted that SOL had been “rejected by its previous support level, now as resistance,” adding that the stochastic oscillator had reached the same overbought region that preceded the last major top. He argued that “there’s a big chance we’ll see further bearish continuation from here.”
Derivatives positioning presents another challenge. CoinGlass liquidation heatmap data shows a dense cluster of leveraged positions between $74 and $76, creating a significant liquidity pocket above current prices.
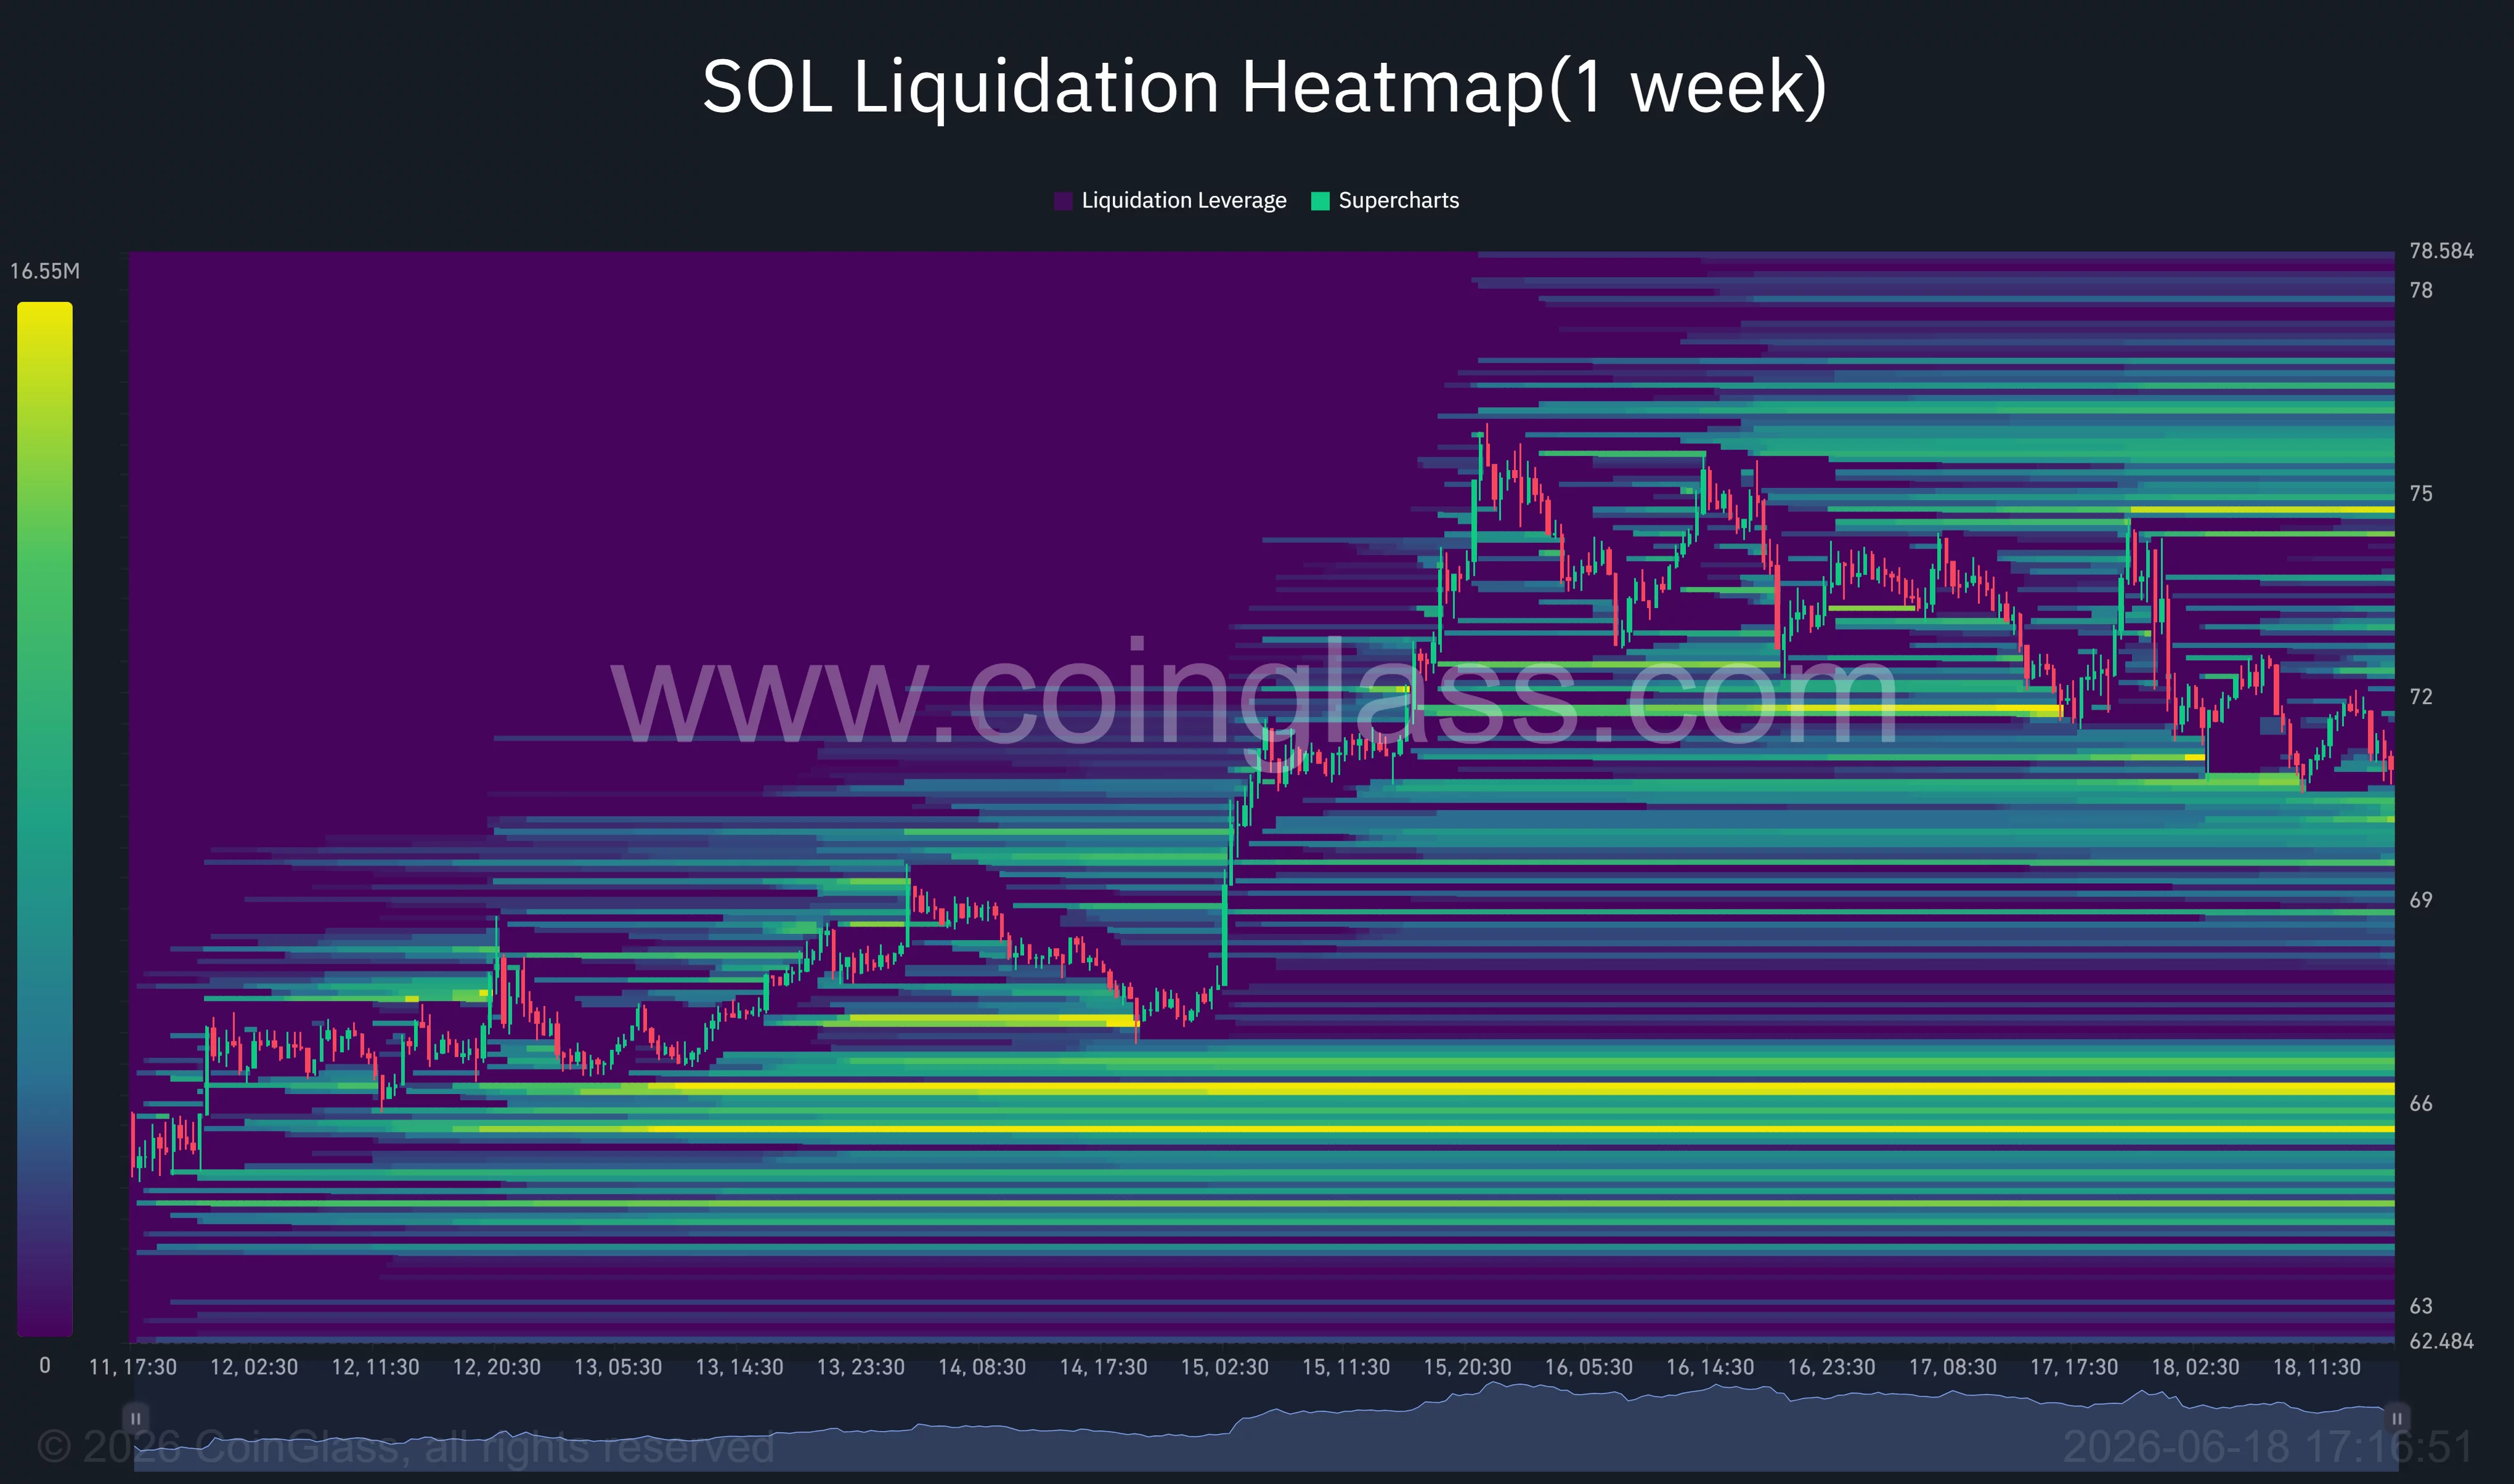
Additional liquidation interest sits near $66, while the largest concentration of liquidity remains around the $65 region. Such clusters often attract short-term price moves as market makers hunt leveraged positions.
A break below $70 could expose June lows
Beyond technical factors, Solana continues to face questions about network activity. DefiLlama data has shown weaker transaction fee generation and slower growth in total value locked compared with earlier stages of the cycle, reducing one of the key drivers behind SOL’s outperformance over the past year.
At the same time, institutional capital has increasingly gravitated toward traditional markets. Strong demand surrounding the SpaceX IPO and continued enthusiasm for artificial intelligence-linked equities have drawn liquidity away from speculative crypto assets. Digital asset investment products have also faced persistent outflows in recent weeks.
The immediate support level remains near $70. A decisive break below that threshold could bring the June low around $62 back into focus, with the Fibonacci extension projecting downside risk toward the $60 area.
On the upside, bulls must first reclaim the $74–$76 resistance band before a broader recovery thesis can regain credibility.
Disclosure: This article does not represent investment advice. The content and materials featured on this page are for educational purposes only.