Strategy stock price outlook: 52% breakout likely amid rising Bitcoin ETF demand



Strategy stock price could be on the verge of a strong bullish breakout as odds of Bitcoin hitting an all-time high rose on Polymarket.
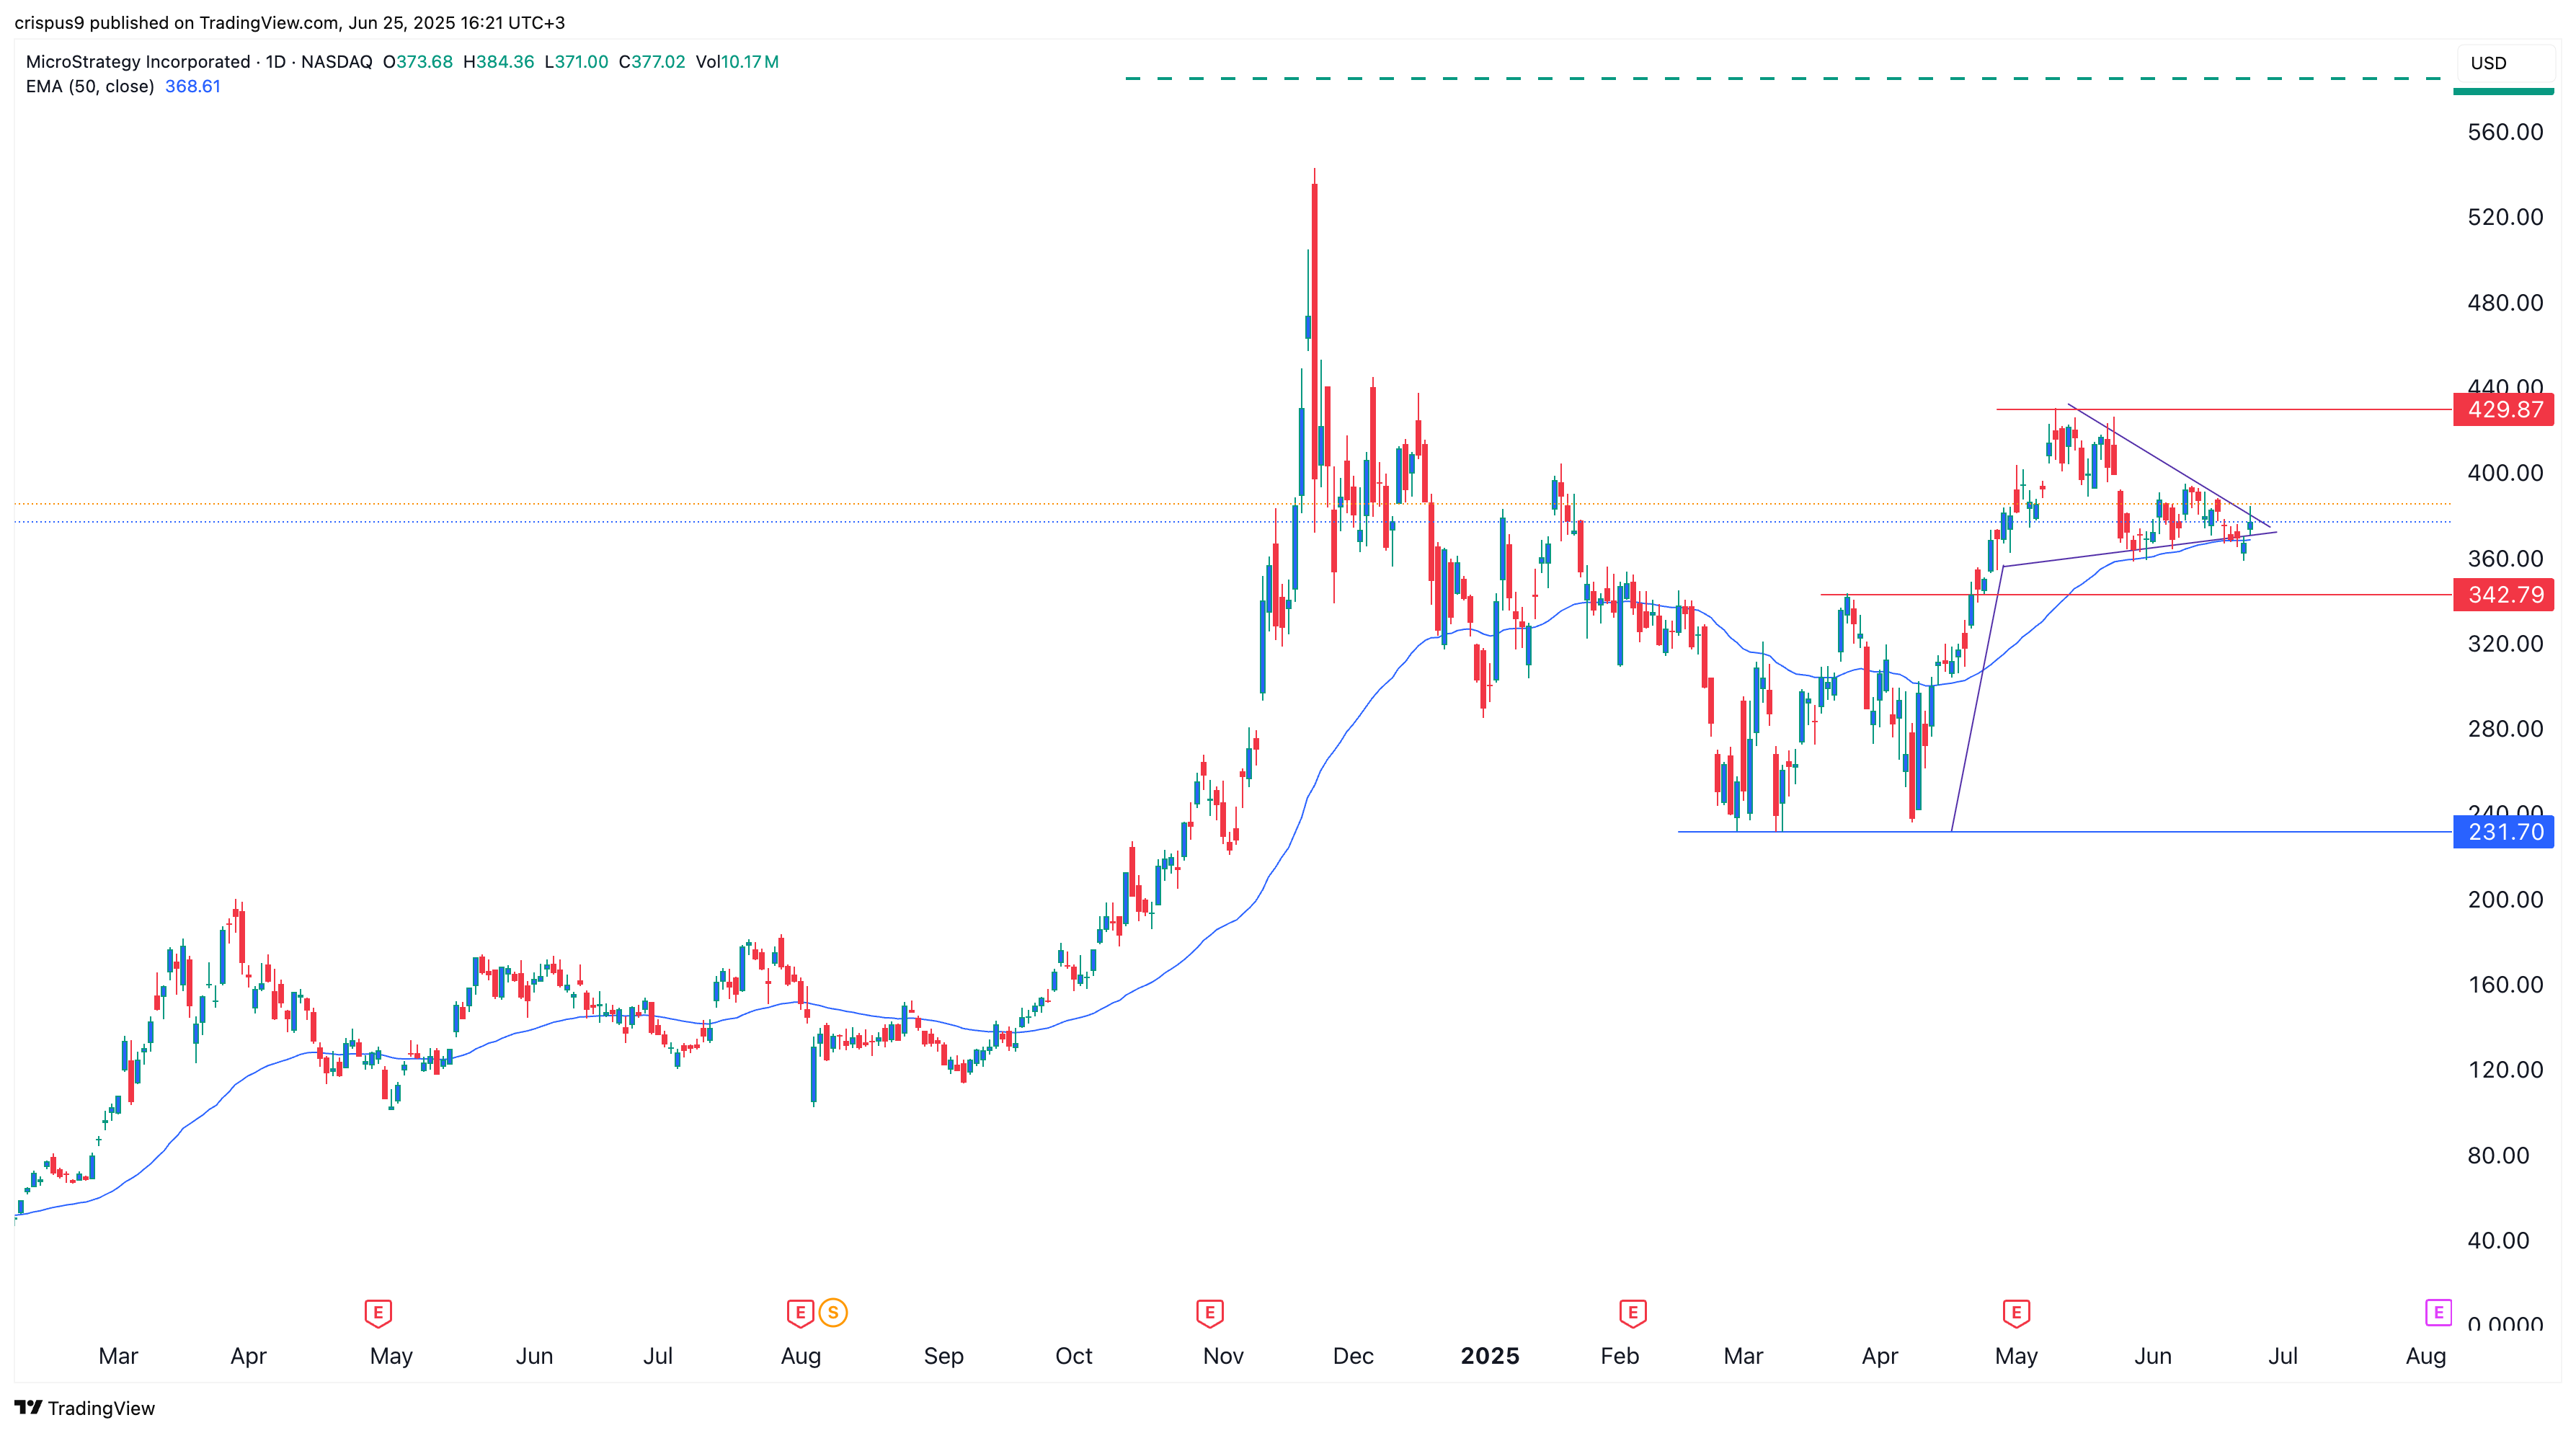
MSTR stock was trading at $377 on Wednesday, a few points above this week’s low of $360. It has jumped nearly 70% from its lowest level this year.
Strategy stock technical analysis points to a surge
The daily chart shows that the MSTR stock price has been in a tight range since May. It has remained above the 100-day and 50-day Exponential Moving Averages, which have provided it with substantial support.
Further, Strategy has formed a bullish pennant pattern, which often leads to additional gains. This pattern is composed of a vertical line and a symmetrical triangle, with a breakout occurring when the two lines near their confluence level.
The profit target in a bullish pennant is established by first measuring the length of the flagpole and then extrapolating the same distance from the breakout point. In this case, the flagpole’s length is $200—$420 minus $230.
The breakout point is $385, bringing the target price to $585, up 52% from the current level. A drop below the support at $342 will invalidate the bullish forecast. This price is the neckline of the double-bottom pattern at $230.
Odds of Bitcoin price hitting all-time high are rising
The main catalyst for the Strategy stock price is the odds of Bitcoin (BTC) hitting a record high before October have jumped to 81% on Polymarket. Such a move would be bullish for Strategy because it holds 592,345 Bitcoins currently valued at over $63 billion.
Bitcoin has strong bullish fundamentals and technicals. For example, Bitcoin supply on exchanges and over-the-counter marketplaces has crashed to the lowest level in years.
Bitcoin ETF demand has jumped, with inflows happening in the last eleven consecutive days. These funds have had a cumulative inflow of $47.9 billion since January last year, with BlackRock’s IBIT having over $72 billion in assets.
Technically, Bitcoin price has formed a cup-and-handle pattern, a popular continuation setup. This pattern consists of a rounded bottom followed by some consolidation, which is currently underway. Therefore, Bitcoin is likely to break out and potentially rise above $140,000 in the near term.
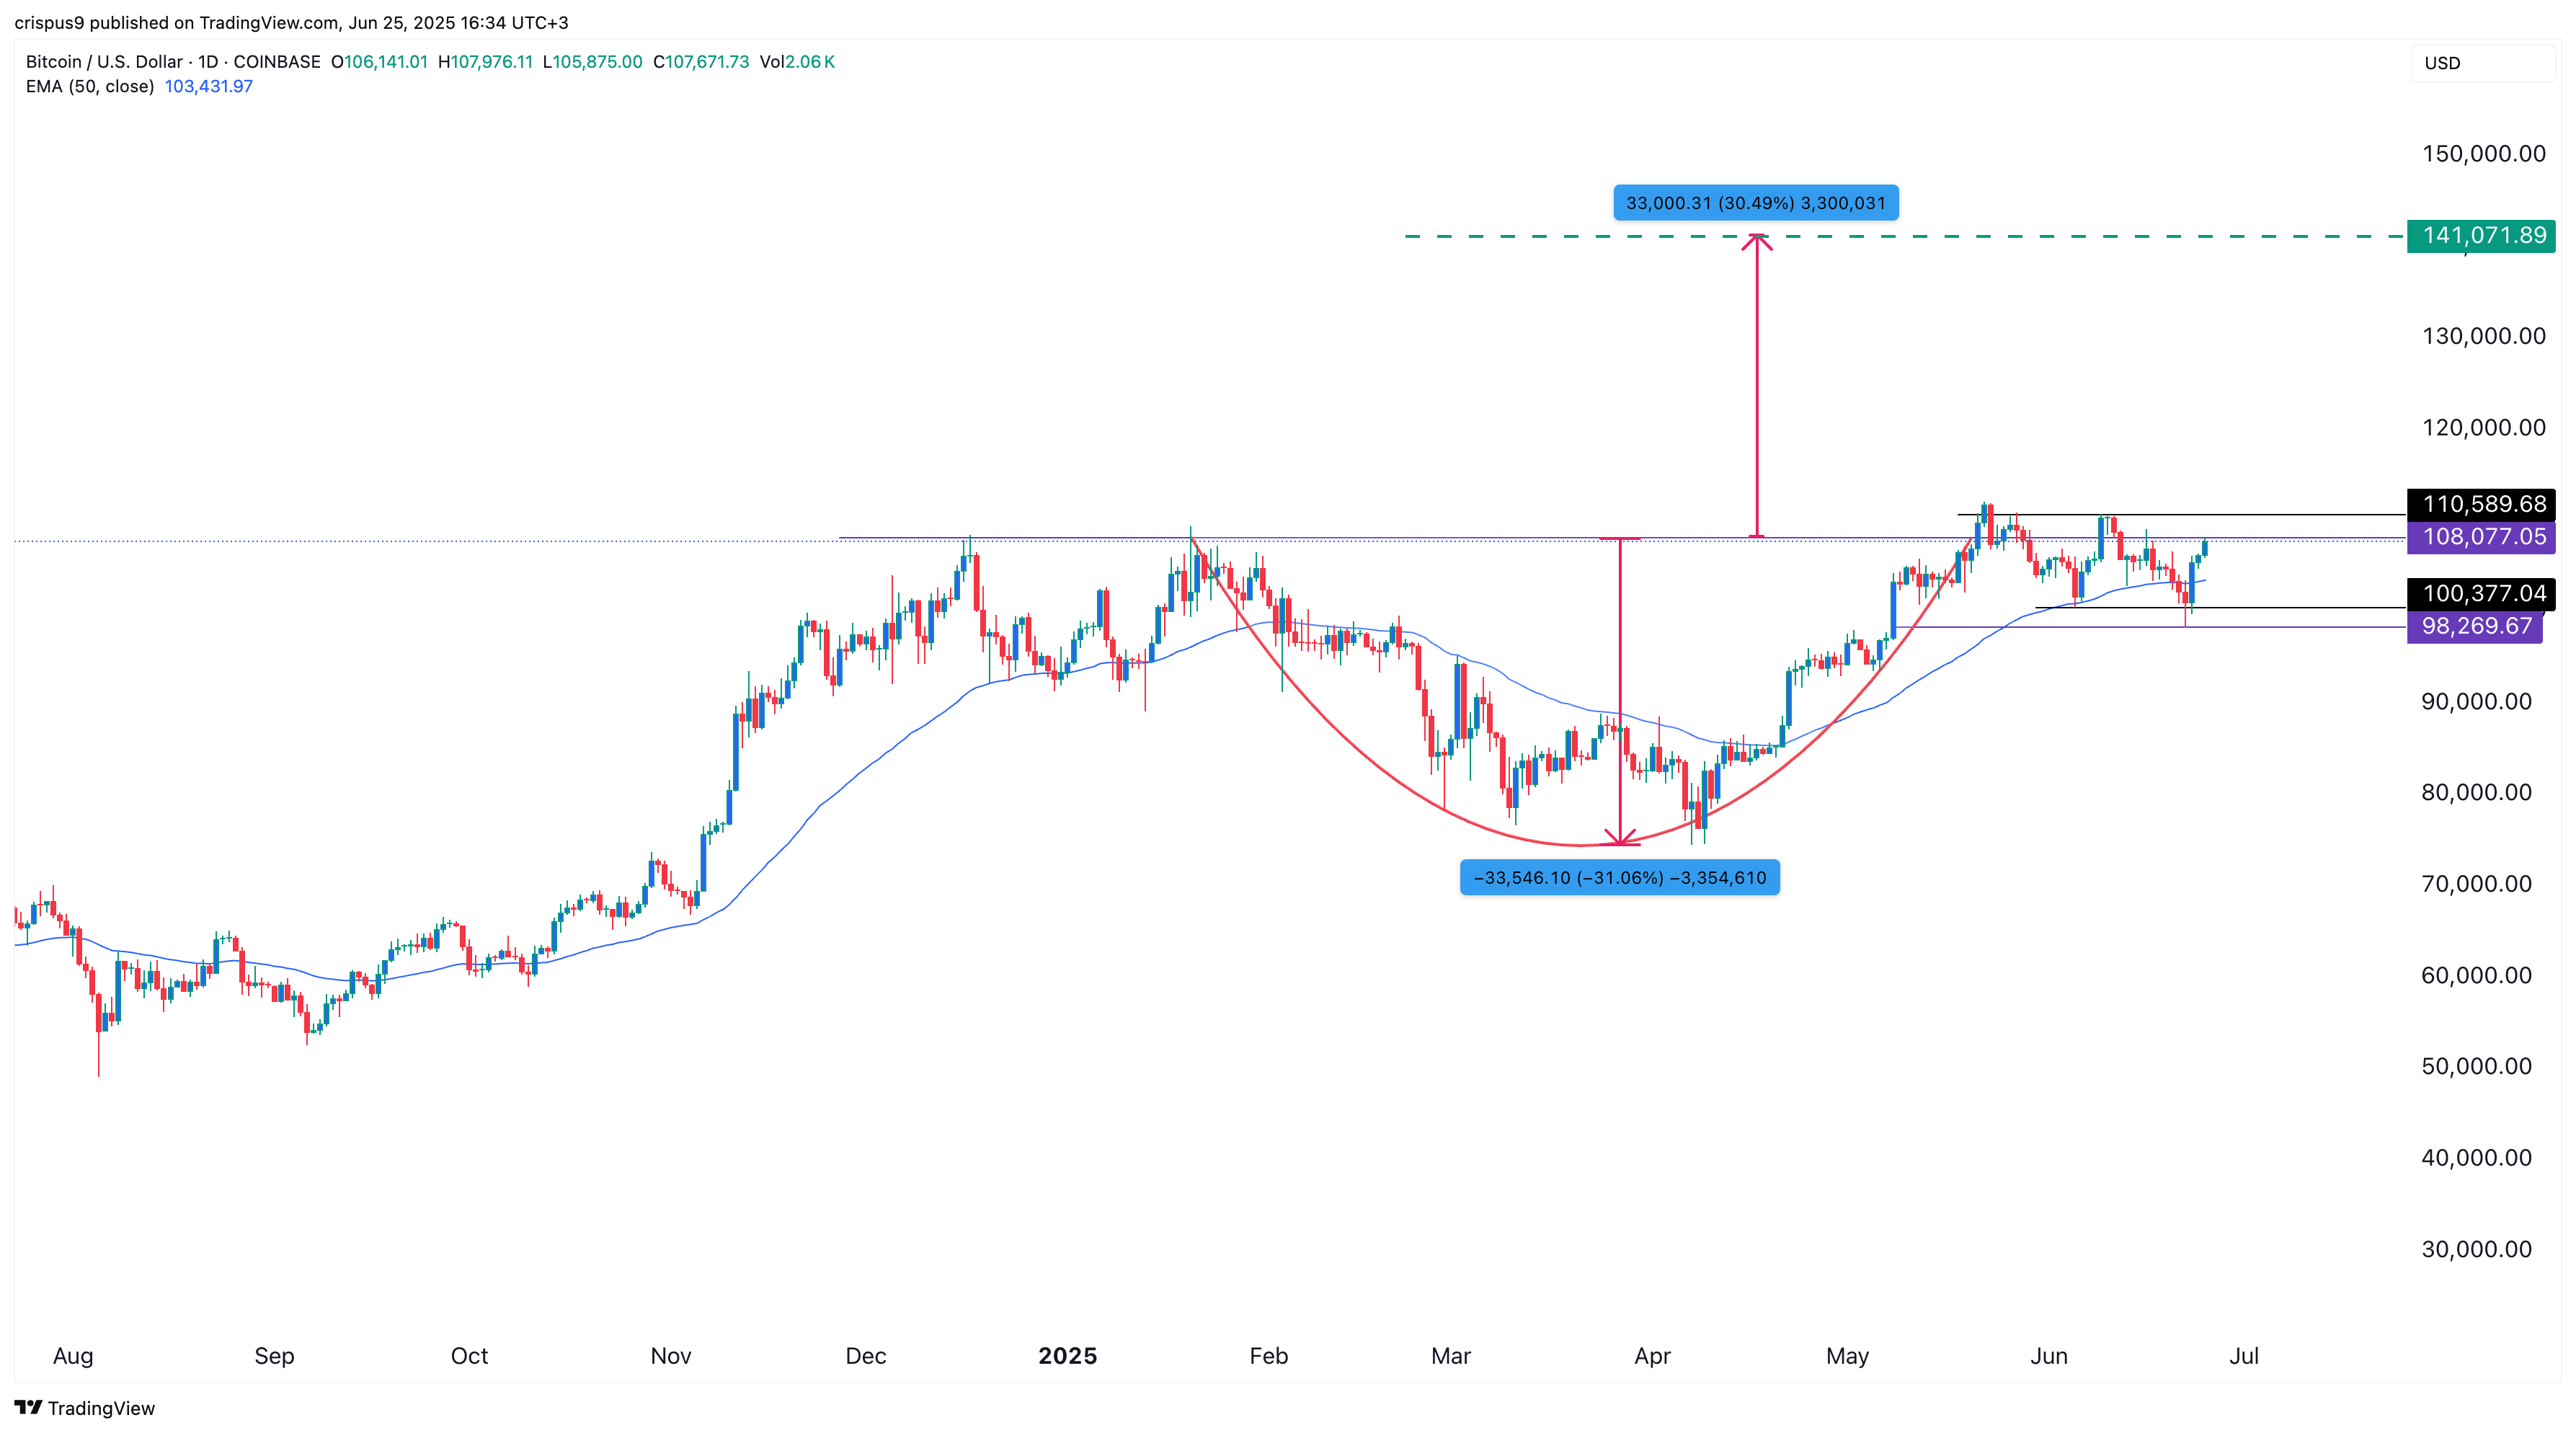
This price target is based on the cup-and-handle pattern, which has a depth of about 30%. Measuring the same distance from the cup’s upper side yields a target price of $141,000.