These patterns point to a steeper Bitcoin price crash as ETF outflows rise


Bitcoin price has plummeted into a bear market after falling by 20% from its highest level this year, and top technical indicators point to a steeper crash in the near term.
- Bitcoin price has slumped into a local bear market this month.
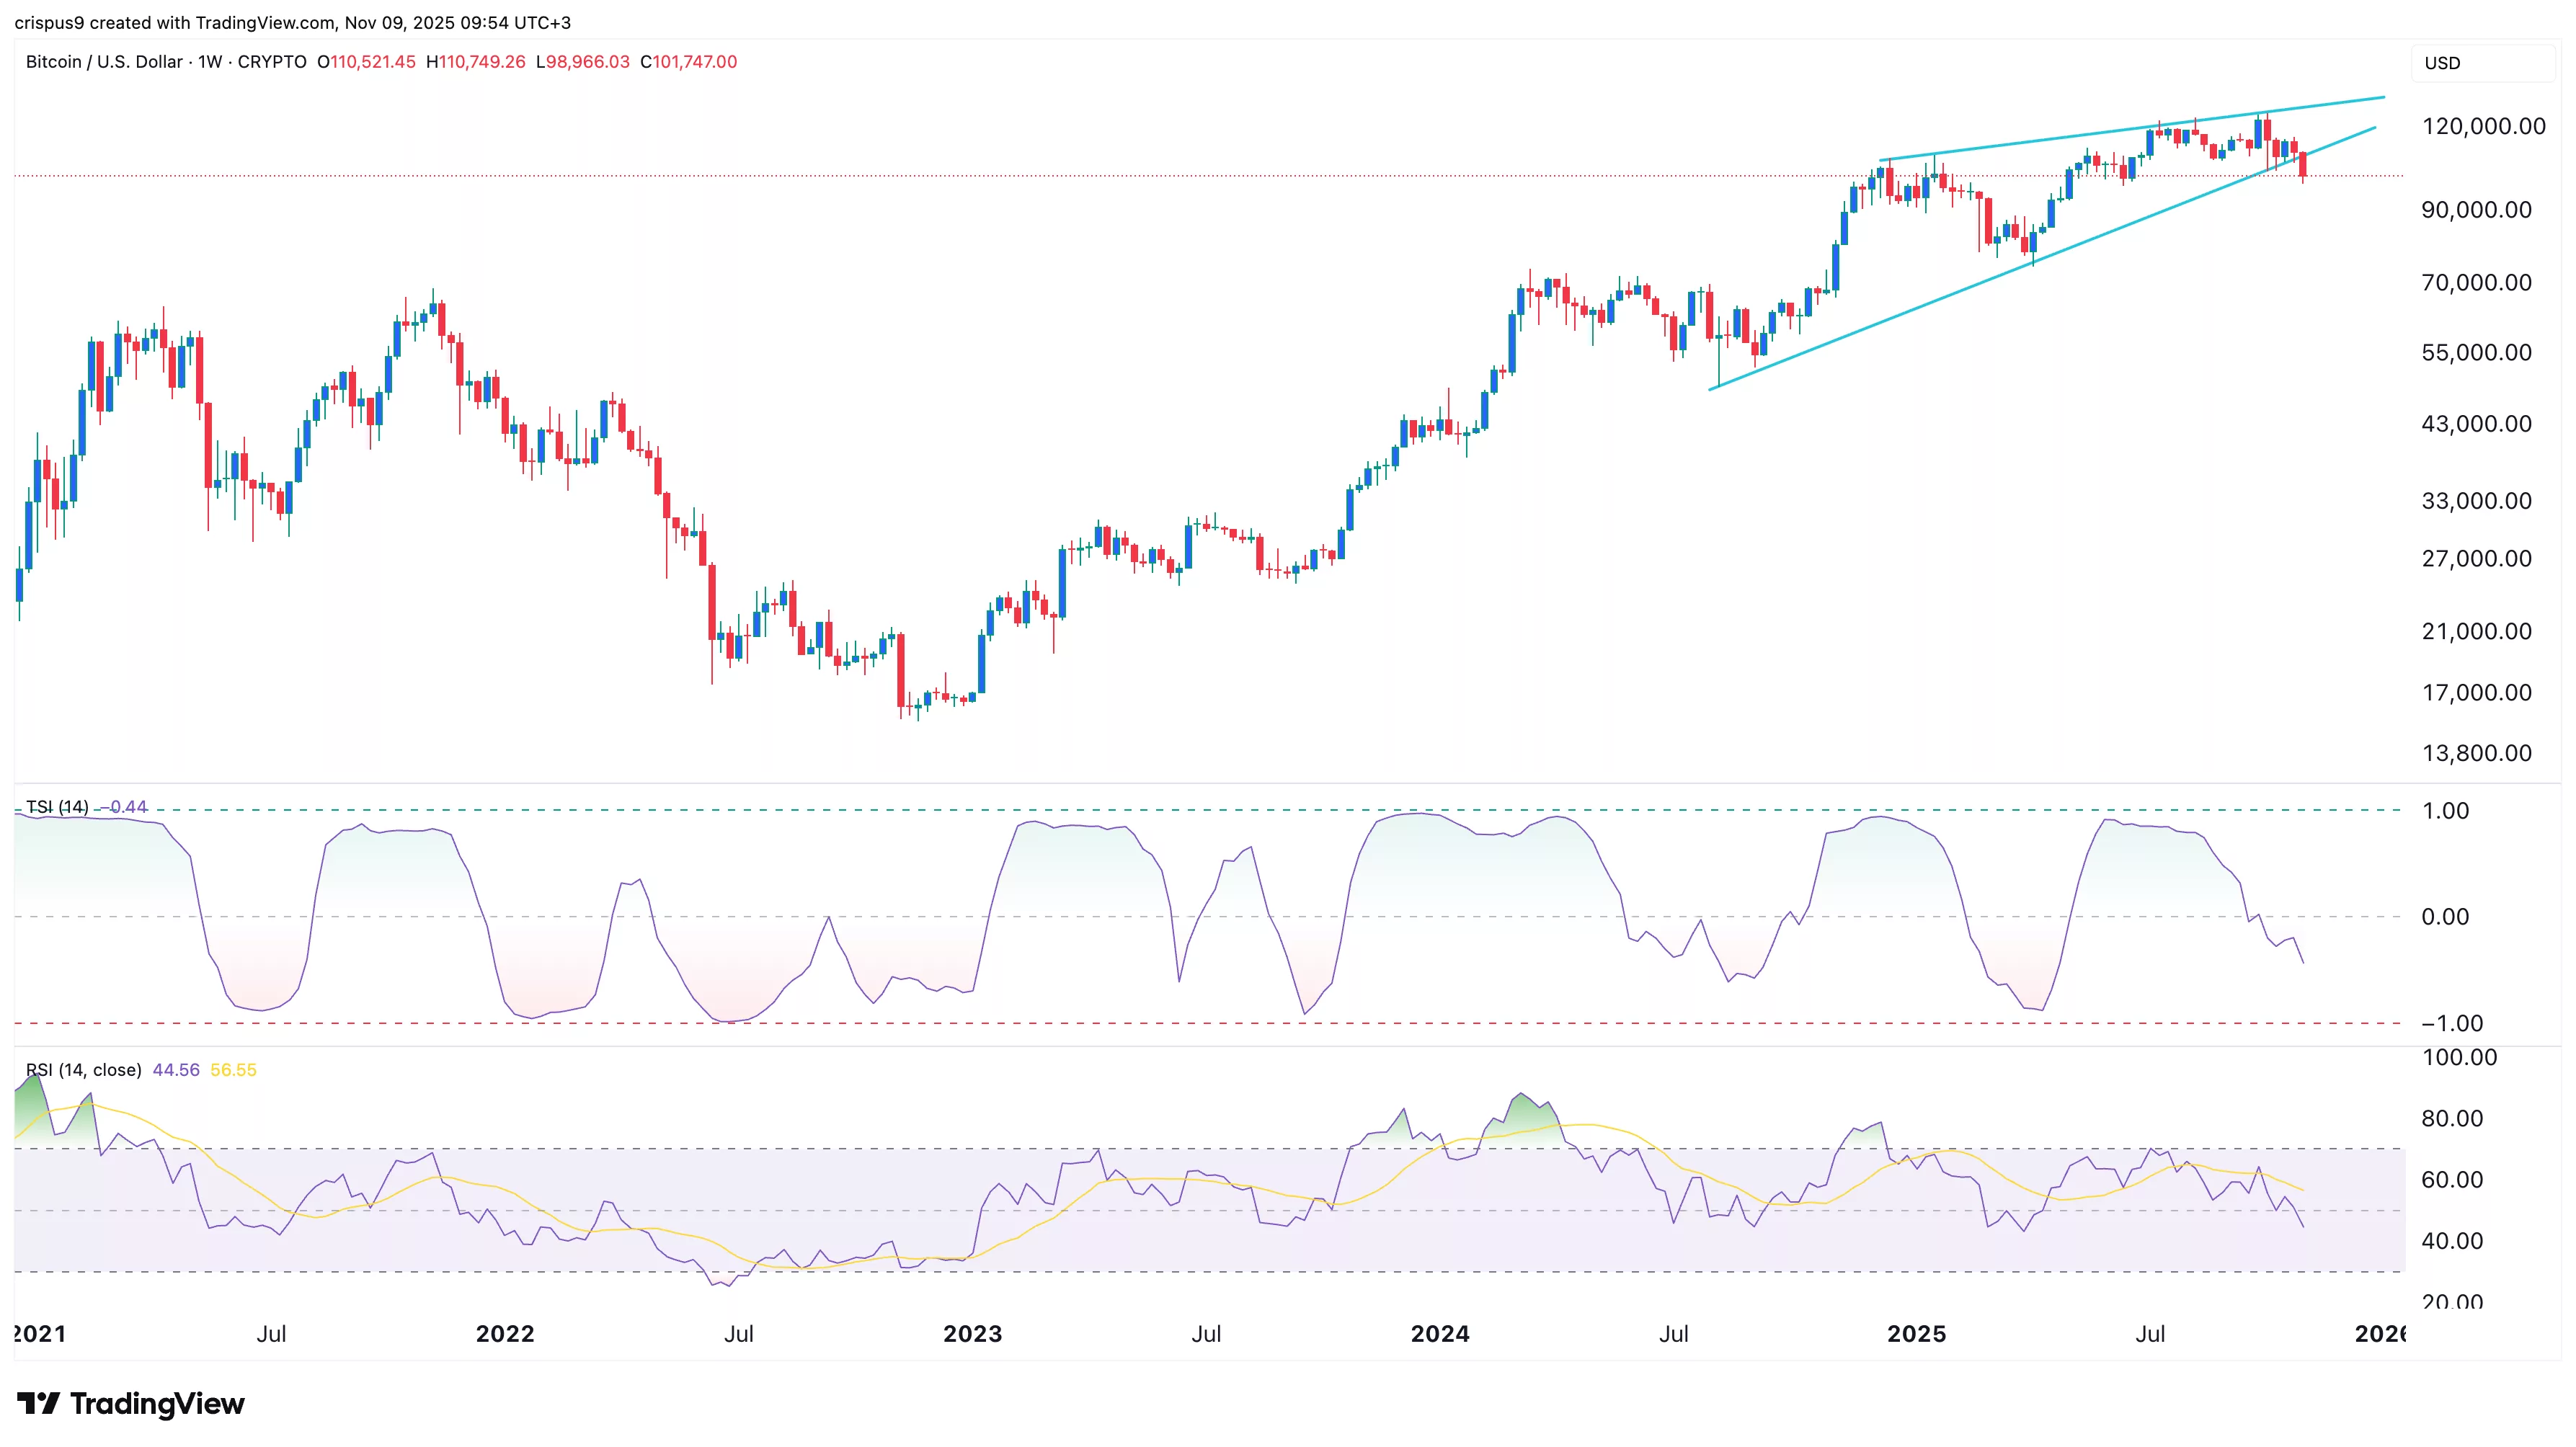
- It has formed a rising wedge on the weekly timeframe chart.
- The coin has formed a bearish pennant pattern on the daily chart.
Bitcoin (BTC) was trading at $101,900 on Sunday, down substantially from the year-to-date high of over $126,300. Its market cap has dropped to about $2 trillion.
BTC price has plunged because of the ongoing deleveraging among investors after the significant liquidations last month. As a result, the futures open interest has plunged to $67 billion, down from a peak of $94 billion last month.
The coin has also plunged amid the ongoing selling by whale investors who have dumped coins worth billions of dollars in the past few months. Whale selling often leads to substantial selling pressure among other retail traders.
Meanwhile, investors have continued to dump their Bitcoin ETFs recently. Data compiled by SoSoValue shows that these ETFs shed over $558 million in assets on Friday. The outflow led to a weekly figure of $1.22 billion, up from the previous week’s $798 million.
Bitcoin price has formed a rising wedge on the weekly chart

The weekly chart suggests that the BTC price could be on the verge of a steeper dive this year. It has formed a rising wedge pattern, which is made up of two ascending and converging trendlines. It has already moved below the lower side of this wedge, confirming a potential crash.
Bitcoin has also formed a bearish divergence pattern. The Relative Strength Index has continued forming a series of lower lows and has now dropped below the neutral point at 50.
The same has happened with the Trend Strength Index, which has moved below the zero line and is pointing downwards.
BTC price has formed risky patterns on the daily chart
The daily chart also shows that the coin has formed several risky chart patterns. It is now in the process of forming a bearish pennant, which is made up of a vertical line and a symmetrical triangle pattern. This pattern normally leads to more downside.
The coin also formed a double-top pattern at $124,496 and a neckline at $107,390. Most importantly, it formed a death cross pattern as the 50-day and 200-day moving averages crossed each other on November 1.
Therefore, the coin will likely continue falling as sellers target the key support at $98,220, its lowest level in June last year. A move below that level will point to more downside, potentially to $95,000.
Disclosure: This article does not represent investment advice. The content and materials featured on this page are for educational purposes only.