

Uniswap price eyes $10.30 as cup-and-handle forms


Uniswap price is testing a possible cup-and-handle setup near $8.92 as its September rally cools and a Japan-focused DeFi partnership advances.
- $10.30 marks the daily chart’s cup resistance, with UNI trading below a descending handle.
- Daily RSI stands at 60.27, while a bearish MACD crossover signals weaker momentum.
- The 4-hour chart places nearby Bollinger Band levels at $8.74 and $9.16.
- SMBC Nikko and partners target mid-2027 completion for a DeFi Gateway using Uniswap v4.
Uniswap’s rounded recovery meets resistance at $10.30
TradingView’s Binance UNI/USDT daily chart puts Uniswap at $8.926 on Oct. 2, down 0.63% for the session. The token reached an intraday high of $9.319 and a low of $8.867 before returning below $9.
The daily structure shows a broad, rounded recovery stretching from the November 2025 peak through the June 2026 lows and back toward September’s highs. The two sides of that formation meet near $10.30, where a horizontal resistance line crosses the chart.
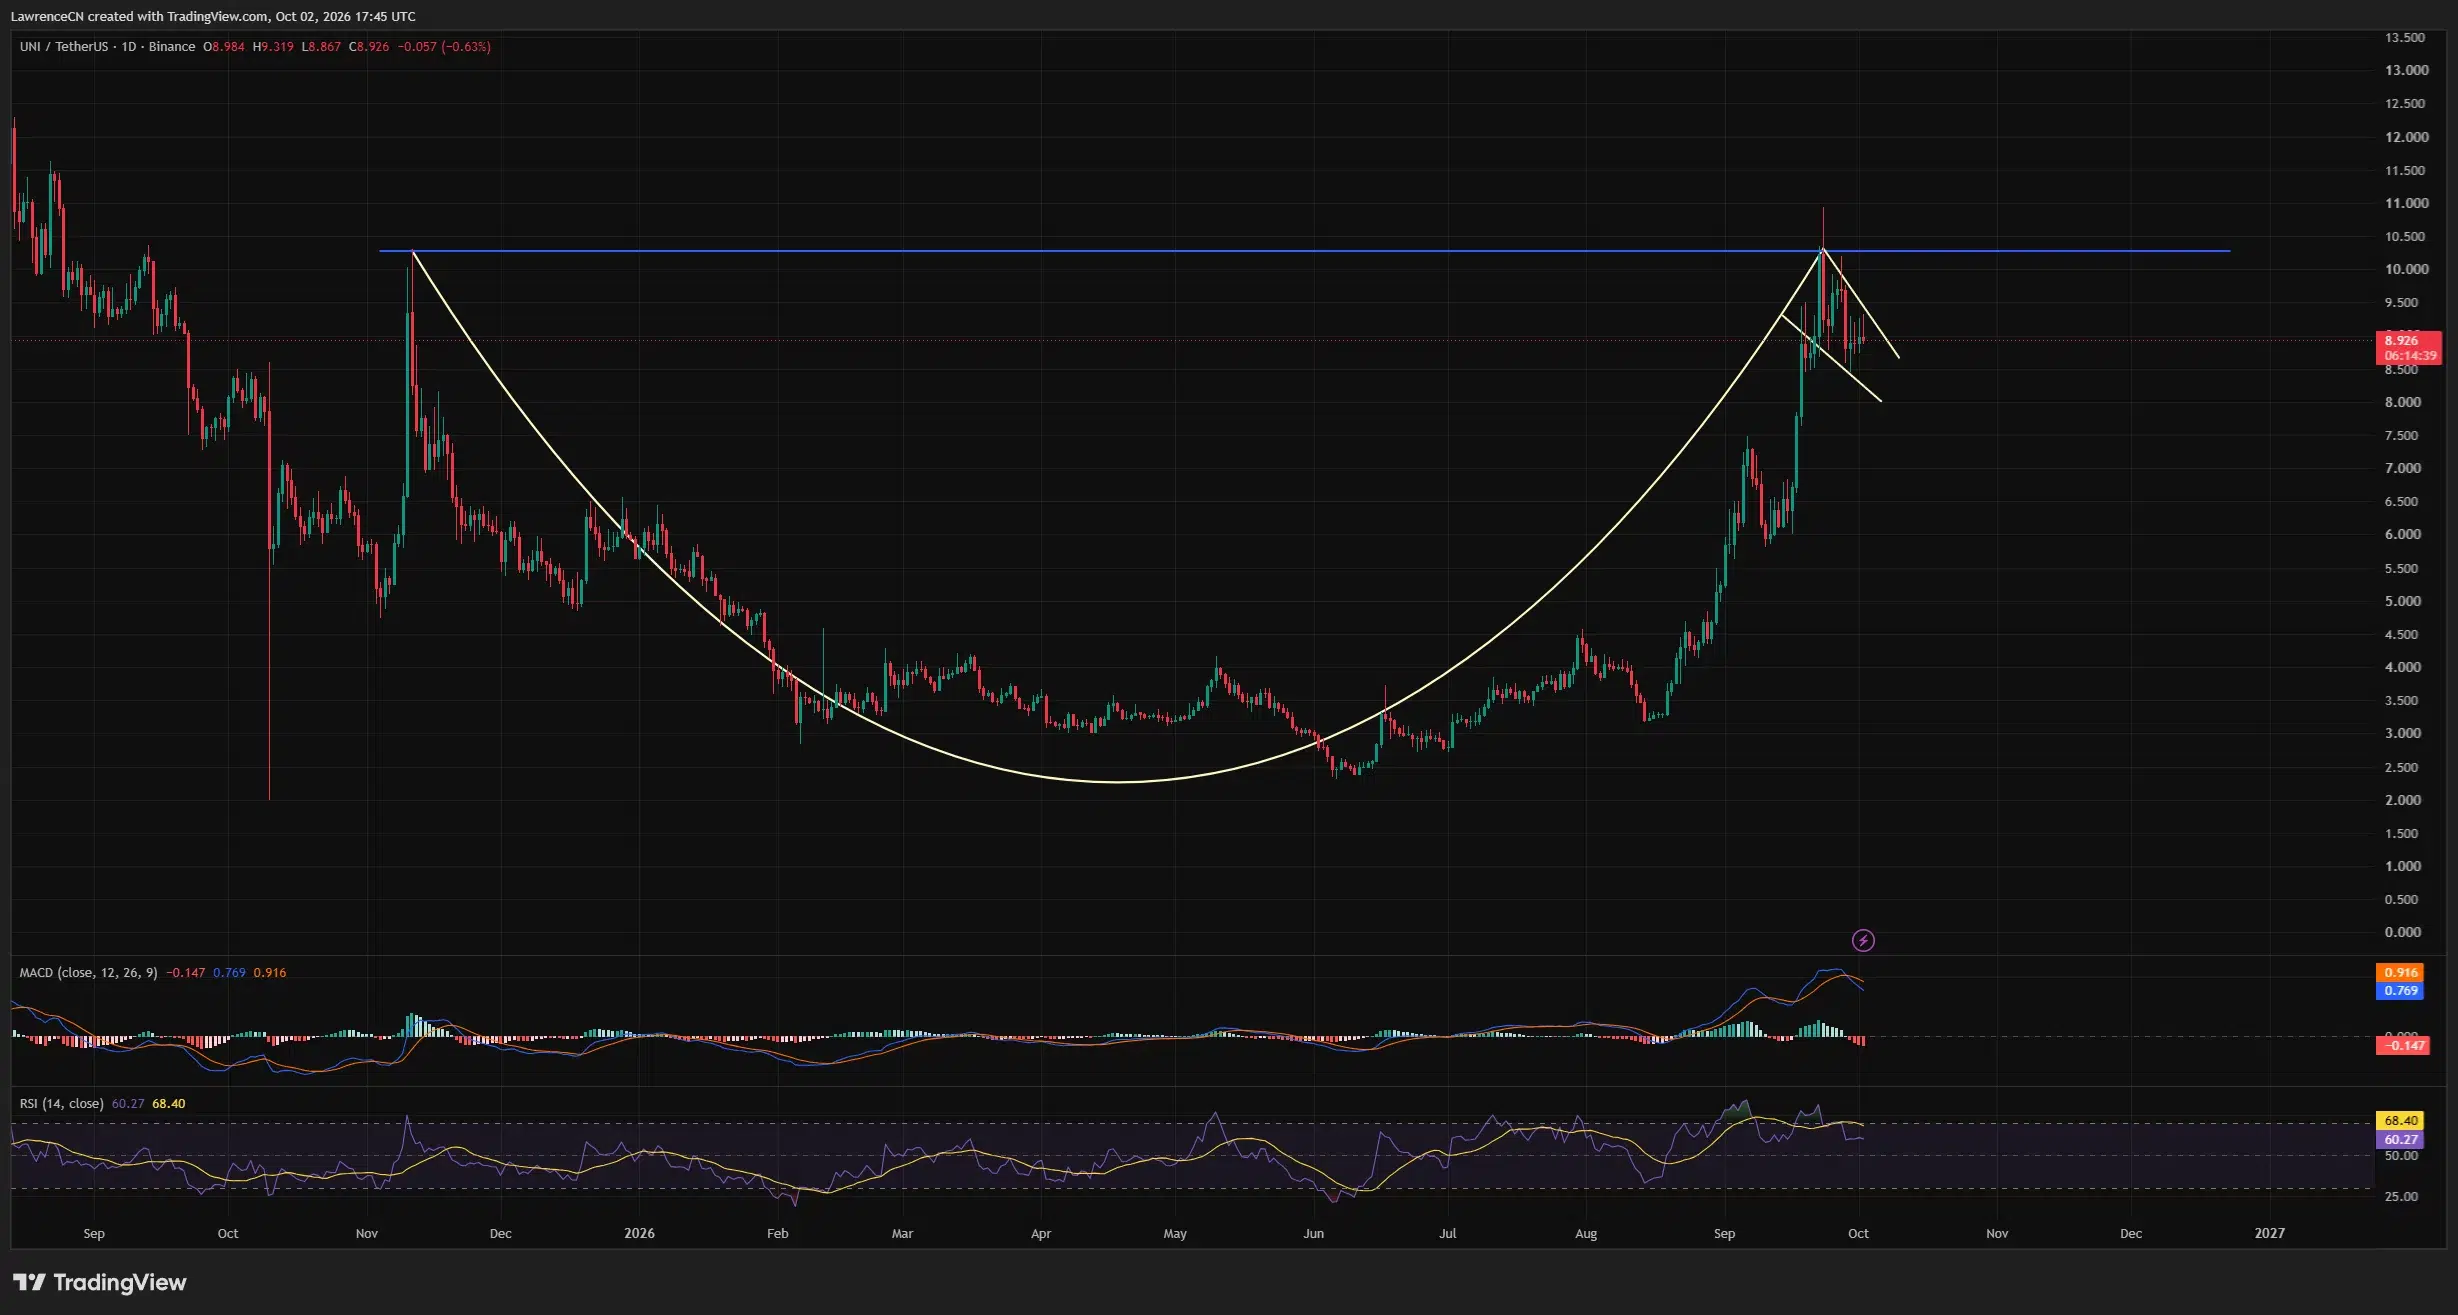
UNI’s latest pullback sits beneath that level, between two descending boundaries. Together, the rounded recovery and smaller retreat resemble a developing cup-and-handle pattern, although price has yet to clear the rim.
The chart places UNI roughly 15% below $10.30. A move above the handle’s upper boundary would be the first bullish step, followed by a test of $10 and the broader resistance near $10.30. A sustained daily close above the rim would strengthen the breakout case.
Daily momentum has weakened during the retreat. The MACD line reads 0.769, below its signal line at 0.916, while the histogram stands at minus 0.147. The bearish crossover shows that the September advance has lost momentum even though both lines remain above zero.
The relative strength index stands at 60.27, above the neutral 50 level but below its average of 68.40. The reading leaves the daily chart with positive momentum, while the gap beneath its average reflects the recent slowdown.
On the downside, the descending structure extends toward approximately $8.00–$8.50. A break through its lower boundary would weaken the handle setup and put that area in focus before another attempt at the cup’s rim.
The 4-hour chart narrows around $8.95
TradingView’s 4-hour UNI/USDT chart shows price at $8.913, just below the Bollinger Bands’ middle line at $8.950. The upper band stands at $9.159, while the lower band sits at $8.740.
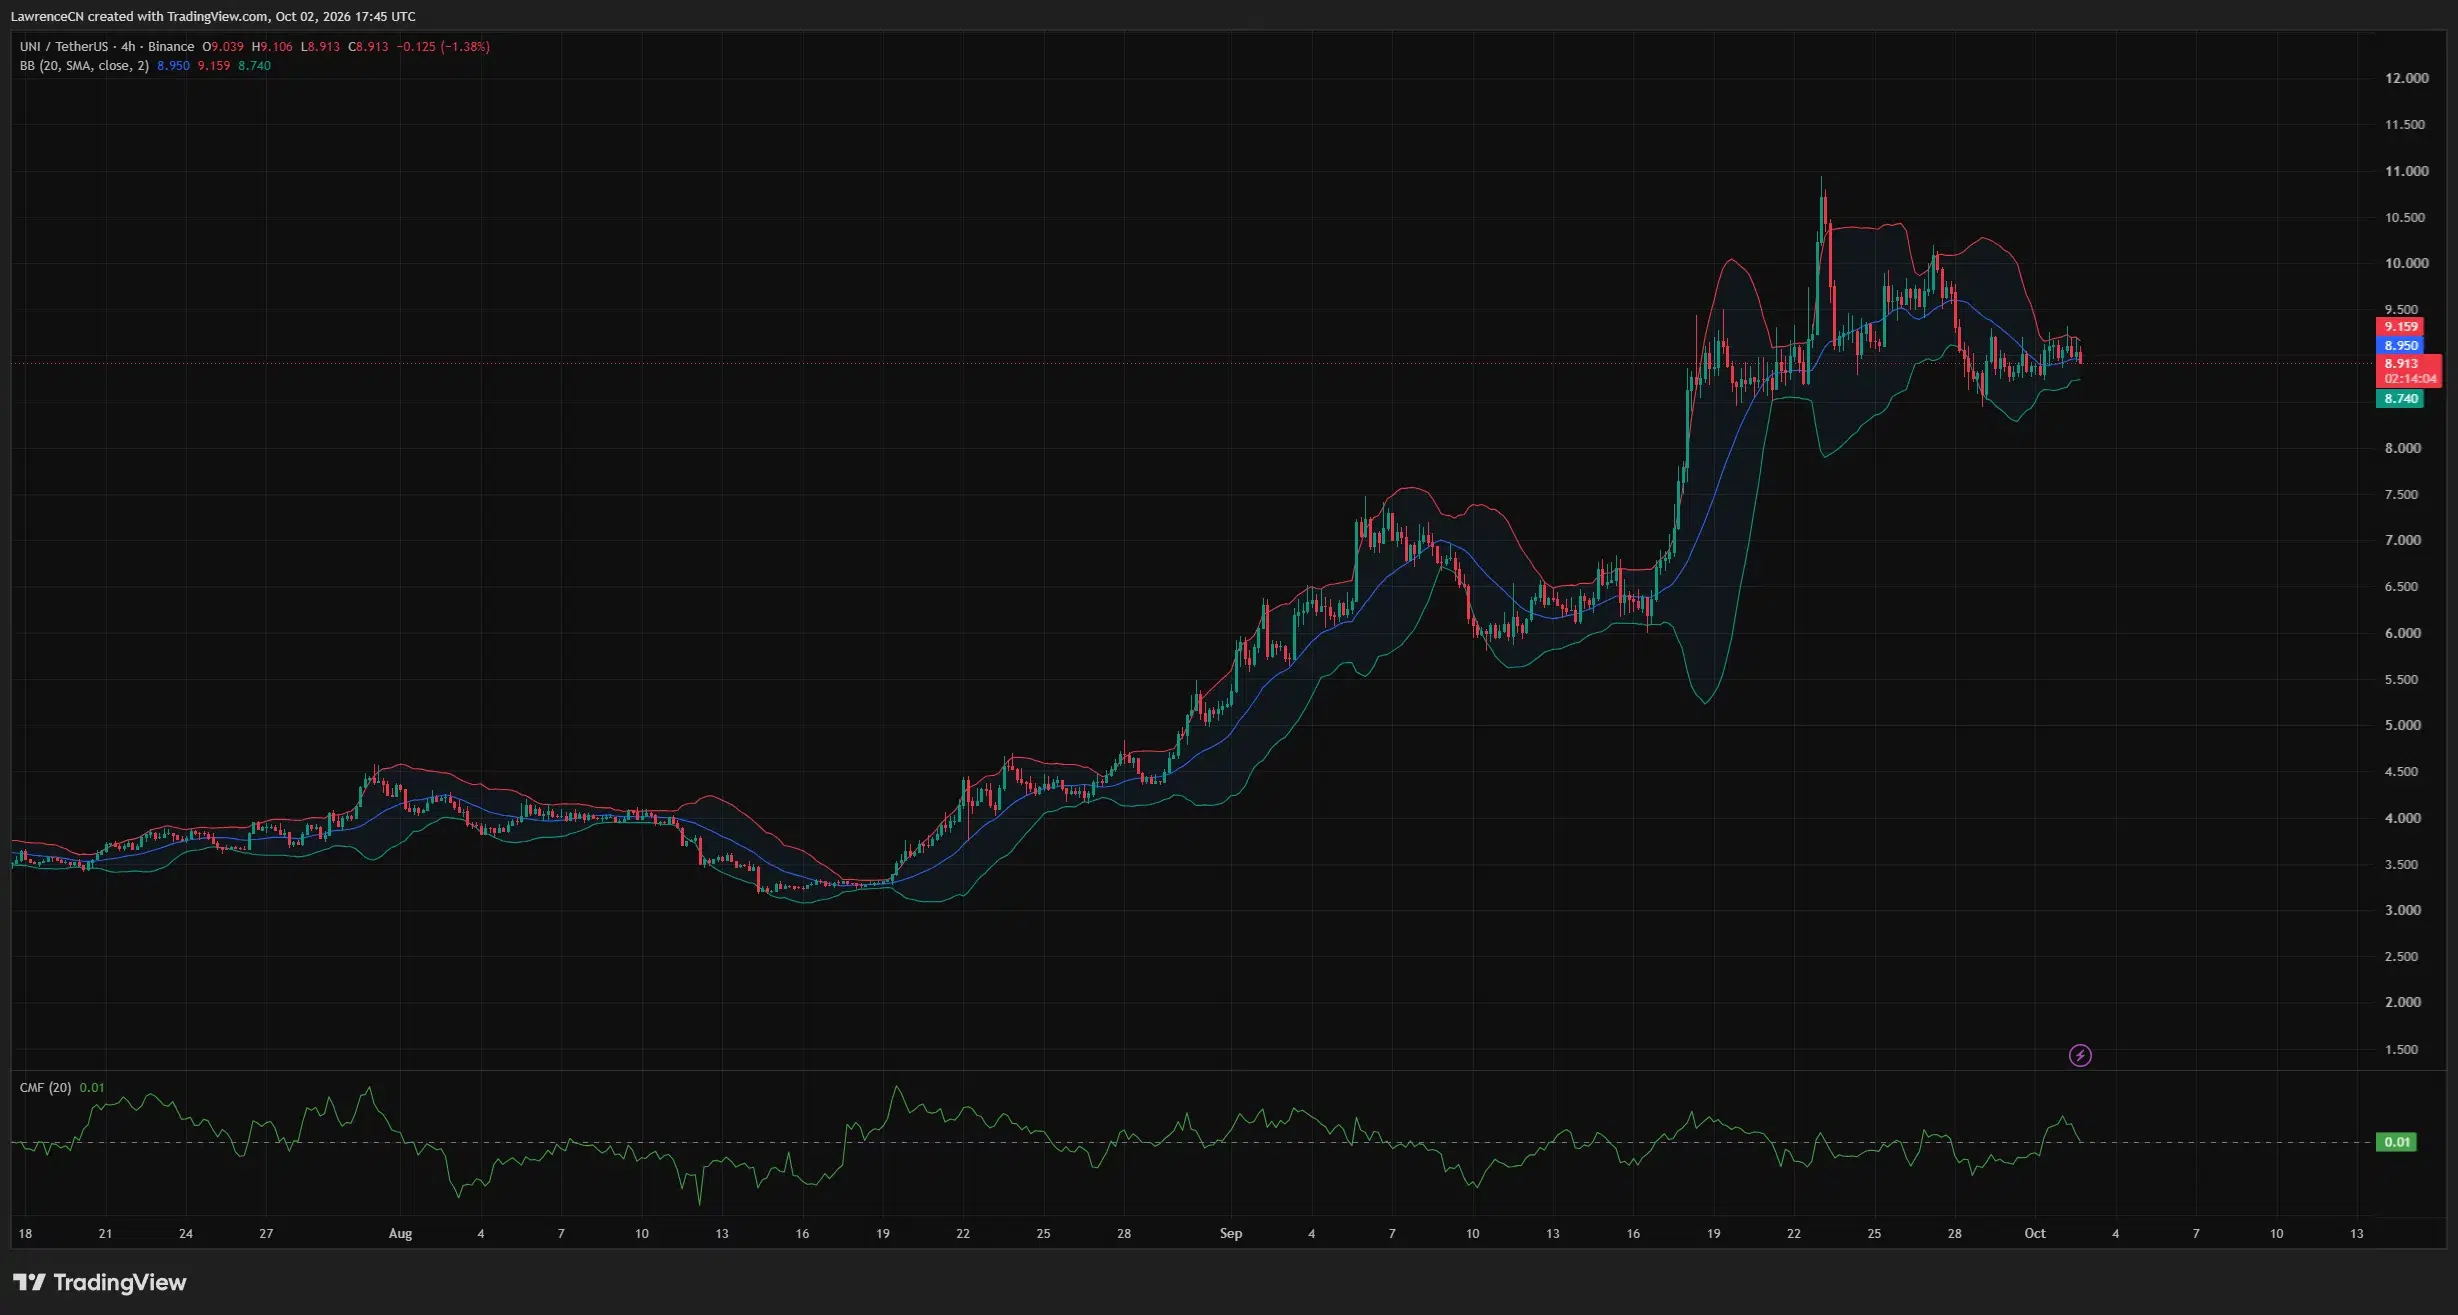
The bands have narrowed following September’s sharp expansion. Recent candles cluster around the middle line after UNI retreated from its late-September peak above $10.50.
At the latest reading, the gap between the upper and lower bands is about $0.42. UNI is trading in the lower half of that range, with $8.95 acting as the nearest level to reclaim and $9.16 forming the next overhead reference.
A sustained move above both levels would improve the short-term structure. Below the lower band, the late-September pullback area around $8.50 becomes the next visible support zone.
The 4-hour Chaikin Money Flow reads 0.01, barely above zero. Buying pressure measured by the indicator is therefore modest, following a brief rise earlier in October. A stronger positive reading alongside a price breakout would offer firmer support for a renewed advance.
Liquidation clusters build near $8.85 and $9.35
CoinGlass’s three-day UNI liquidation heatmap shows a bright overhead concentration around $9.34–$9.35. Additional bands appear near $9.40 and across $9.50–$9.60.
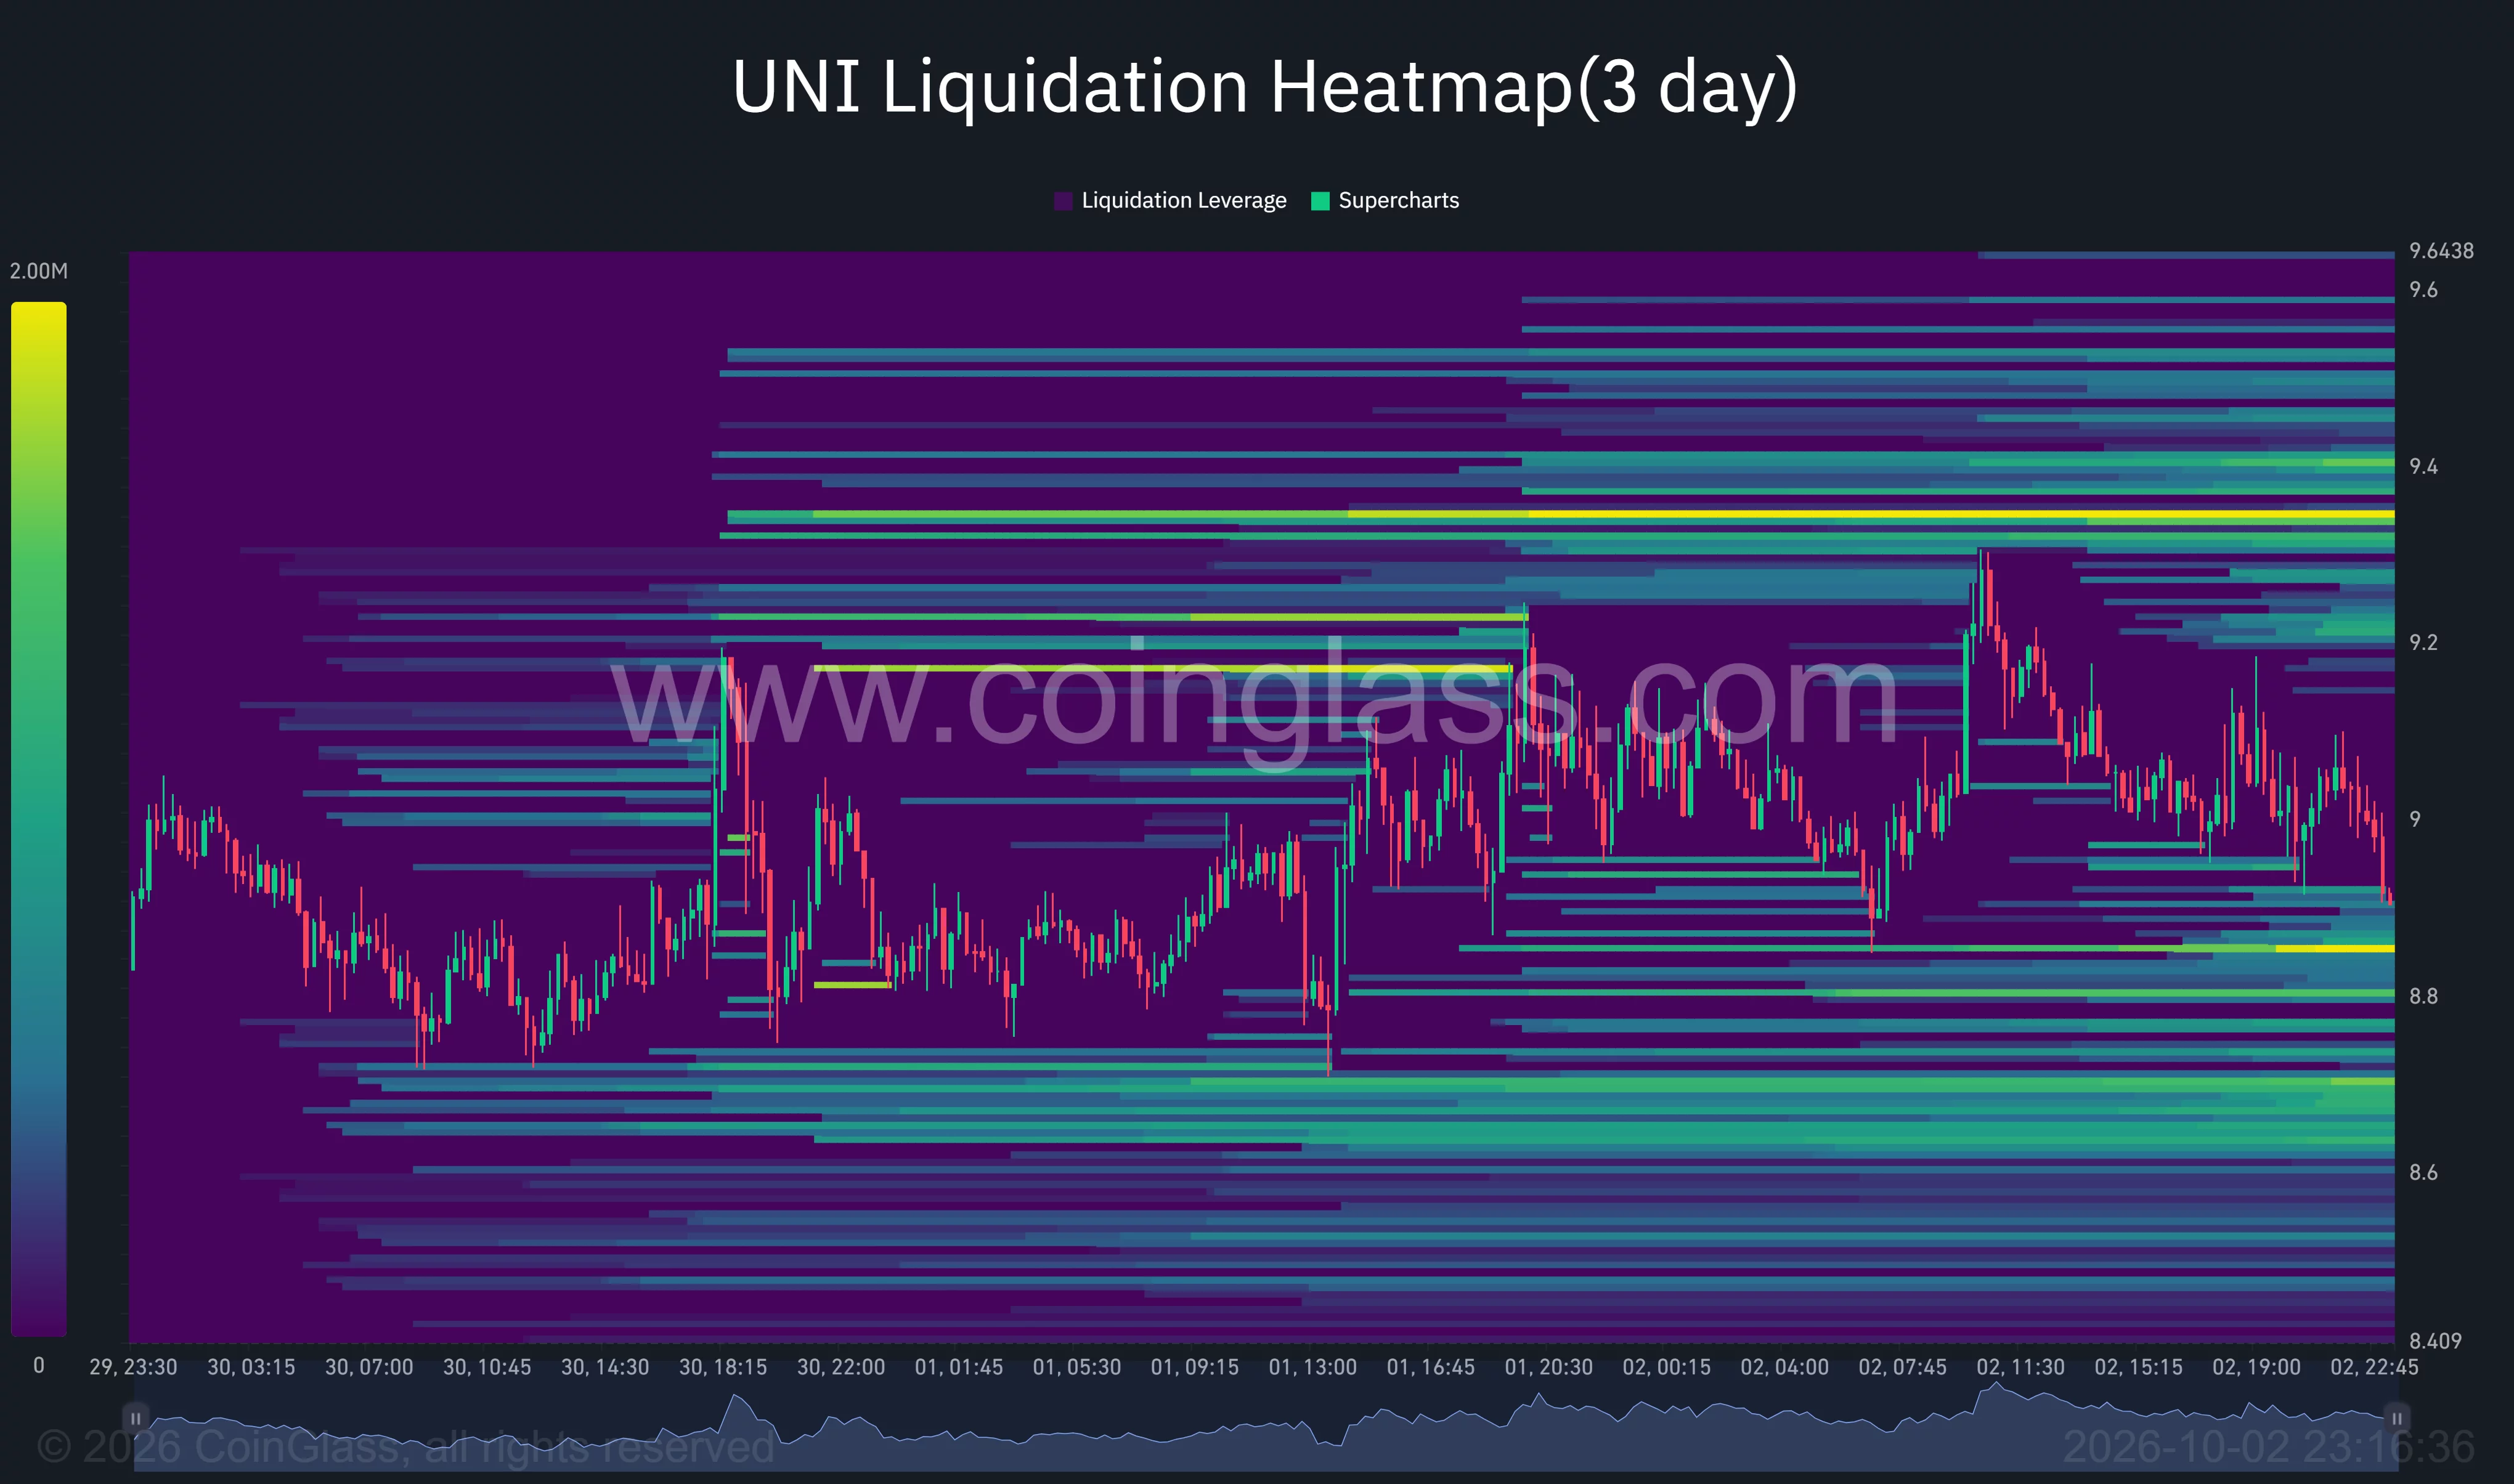
Below the latest price, a bright concentration sits near $8.85, with further clusters around $8.70 and $8.65. UNI’s retreat toward $8.90 has brought it close to the nearest downside band.
The heatmap places estimated liquidation exposure on both sides of the current range. A drop through $8.85 could expose leveraged long positions to forced closures, while a rise toward $9.35 could put nearby short positions under pressure.
The lower concentrations sit close to the 4-hour chart’s lower Bollinger Band and recent support area. Above price, the $9.35 cluster is an intermediate level before the daily chart’s $10–$10.30 resistance zone.
Analysts watch a wedge breakout and futures positioning
Crypto With Gopal identified a falling wedge on UNI’s 1-hour chart in an Oct. 2 post. The analyst described consolidation between roughly $8.50 and $10, with lower highs and lower lows narrowing the structure.
Gopal placed a possible breakout target near $11.50, conditional on price clearing the wedge’s upper boundary. That projection sits beyond the daily cup resistance and requires a confirmed breakout first.
Separately, analyst CW said UNI’s net position delta was gradually increasing during sideways trading. CW interpreted the futures positioning as a sign of improving upward momentum and growing upside potential.
SMBC Nikko partnership targets Japan’s DeFi market
Nethermind said it is co-leading a DeFi Gateway with SMBC Nikko Securities under an agreement involving Uniswap Labs, Base and Nyx Foundation.
The partners plan to use Uniswap v4 hooks to build liquidity pools with anti-money laundering, counter-terrorism financing and investor protection controls. Nethermind said it will lead technical design and delivery, including engineering, AI strategy and smart contract security.
Crypto.news reported the gateway plans, including a mid-2027 completion target and progress updates for Japan’s Financial Services Agency. Base, the Ethereum layer-2 network developed by US exchange Coinbase, provides a US industry connection to the Japan-focused project.
The development adds an institutional use case for Uniswap’s infrastructure while UNI remains below its daily breakout level. On the charts, reclaiming $9.16 and clearing $9.35 would precede another test of $10.30, while losing $8.74–$8.85 would leave nearby downside support exposed.
Disclosure: This article does not represent investment advice. The content and materials featured on this page are for educational purposes only.