



Bitcoin price falls below $82K as spot ETFs see $635M in outflows



Bitcoin price has fallen below $82,000 on October 23, declining 0.97% to $81,449.88 as renewed selling followed its rejection near $85,000.
- Bitcoin price fell 0.97% to $81,449.88 on October 23 after retreating from resistance near $85,000.
- U.S. spot Bitcoin ETFs reportedly recorded $635 million in net outflows following three consecutive inflow sessions.
- CoinGlass figures showed $406.27 million in cryptocurrency liquidations, affecting 89,596 traders over 24 hours.
- Technical indicators suggest BTC must reclaim $82,559 to strengthen its recovery, with support near $78,422.
According to crypto.news market data, the cryptocurrency recorded approximately $29.85 billion in daily trading volume, with its market capitalization standing near $1.64 trillion. The decline followed an intraday slide toward $80,989, while Ether, XRP, Solana and Dogecoin traded under similar pressure.
Why is Bitcoin price falling today?
The latest retreat follows Bitcoin’s unsuccessful attempt to sustain a recovery above $84,000. After reaching approximately $84,778, BTC surrendered its gains and briefly traded below $81,000, bringing the $80,000 support area back into focus.
According to SoSoValue data, U.S. spot Bitcoin ETFs recorded $635.49 million in net outflows on October 22, ending three consecutive sessions of inflows totaling approximately $1.08 billion. The withdrawals marked a reversal in ETF flows after investors added substantial capital to the funds during the preceding trading sessions.
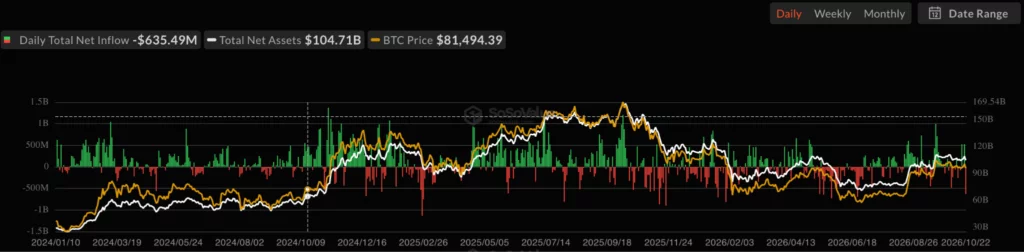
The inflow streak began with $526.6 million on October 19 and continued with $23.16 million on October 20. On October 21, the funds attracted approximately $528.4 million, as crypto.news reported on Bitcoin ETF inflows despite the cryptocurrency’s retreat.
The October 22 withdrawals represented the largest single-day net outflow since June 25, according to SoSoValue. The reversal brought October’s cumulative net ETF flows to approximately $174.5 million in withdrawals, although the fund data does not independently establish what caused Bitcoin’s price decline.
Bitcoin liquidations rise amid macroeconomic pressure
The cryptocurrency market experienced substantial derivatives liquidations as prices declined. According to CoinGlass liquidation data, exchanges liquidated approximately $406.27 million in positions belonging to around 89,600 traders over 24 hours.
The largest reported individual liquidation occurred on Hyperliquid, involving a BTC-USD position valued at $7.93 million. These figures cover the cryptocurrency market overall, not Bitcoin positions alone, and require matching timestamp checks before publication.
Macroeconomic concerns have complicated the recovery. Crypto analyst Darkfost highlighted rising oil prices, pointing to Brent crude trading above $100 amid tensions in the Gulf and attacks affecting Russian refining infrastructure.
The analyst argued that sustained energy costs could put pressure on inflation, economic growth and liquidity available to speculative markets. However, he cautioned against assuming a direct causal relationship between oil prices and Bitcoin performance.
Concerns about excessive leverage were present before the latest decline. A previous Bitfinex market assessment warned that futures positioning had grown despite weaker Bitcoin prices, creating conditions for further liquidations if selling resumed.
Bitcoin price prediction: Can BTC recover above $82,500?
Bitcoin’s daily technical indicators show the cryptocurrency struggling to recover its recent trading range. At a chart reading of $81,906.77, BTC remained below the Keltner Channel’s middle band at $82,559.13, with the lower boundary positioned at $78,421.85.
A sustained move above $82,559 could improve short-term momentum and bring the upper channel boundary near $86,696 into consideration. Failure to reclaim that level would leave BTC exposed to another test of the $80,000 area, followed by the lower Keltner boundary.
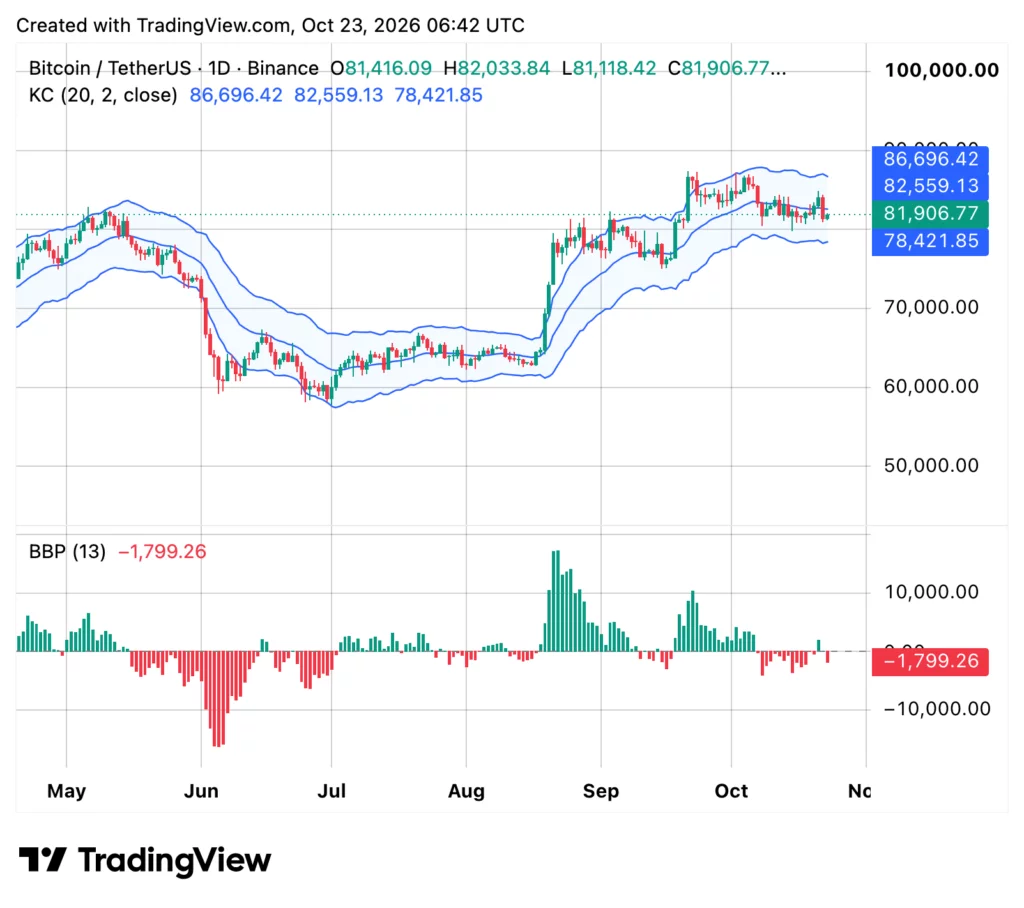
The Bull Bear Power indicator stood at -1,799.26, indicating that sellers retained the advantage. Its negative histogram bars had begun contracting, however, suggesting bearish momentum was moderating despite the absence of a confirmed reversal.
Crypto analyst Michaël van de Poppe identified $82,900 as a level that could invalidate the recent downward pattern. He highlighted 78,400–79,700 as another area to monitor if Bitcoin moves below $80,000.
Meanwhile, Alex Marzell’s technical assessment identified the 81,000–82,000 region as important channel support. His downside scenario placed the next support area near $75,000 if Bitcoin failed to defend the channel’s middle boundary.
Bitcoin price history shows repeated resistance near $85,000
Bitcoin price yesterday remained under pressure after the cryptocurrency retreated from its October 21 high near $84,778. The latest figures place BTC down approximately 0.38% over seven days and around 2.7% since the beginning of October.
Recent Bitcoin price history analysis identified $81,000 as an important support area during the October 19 recovery. Analyst Ali Martinez warned that losing that level could expose Bitcoin to a deeper decline, while $84,000 and $86,500 remained recovery targets.
The Bitcoin price live snapshot places the cryptocurrency at $81,449.88, below the Keltner middle band and the $82,900 level identified by van de Poppe. Analyst Satoshi Stacker warned that Bitcoin was approaching a daily close below its 50-day moving average, a technical development he associated with mixed historical outcomes.
Disclosure: This article does not represent investment advice. The content and materials featured on this page are for educational purposes only.