


XRP price drops 5% as $1.05 support breaks, more downside ahead?


XRP price fell about 5% to $1.05 on July 28 as a broader risk-off move and forced long liquidations pushed the token below a closely watched technical floor.
- XRP dropped from roughly $1.11 to $1.05, breaking support near $1.054.
- The 4-hour RSI fell to 25.93, placing XRP in oversold territory.
- Daily Chaikin Money Flow reached -0.12, showing continued net capital outflows.
- Liquidation clusters near $1.075 and $1.097 could limit an early recovery.
XRP price breaks below a double-top neckline
According to data from crypto.news, XRP (XRP) price traded at $1.049 at the time of writing after reaching an intraday low of $1.0486 on Binance. The decline extended a broader downtrend that has kept the token under pressure since May.
The 4-hour chart shows XRP forming two rounded peaks near $1.17, creating a double-top structure. Both advances lost momentum before buyers could establish support above $1.15.
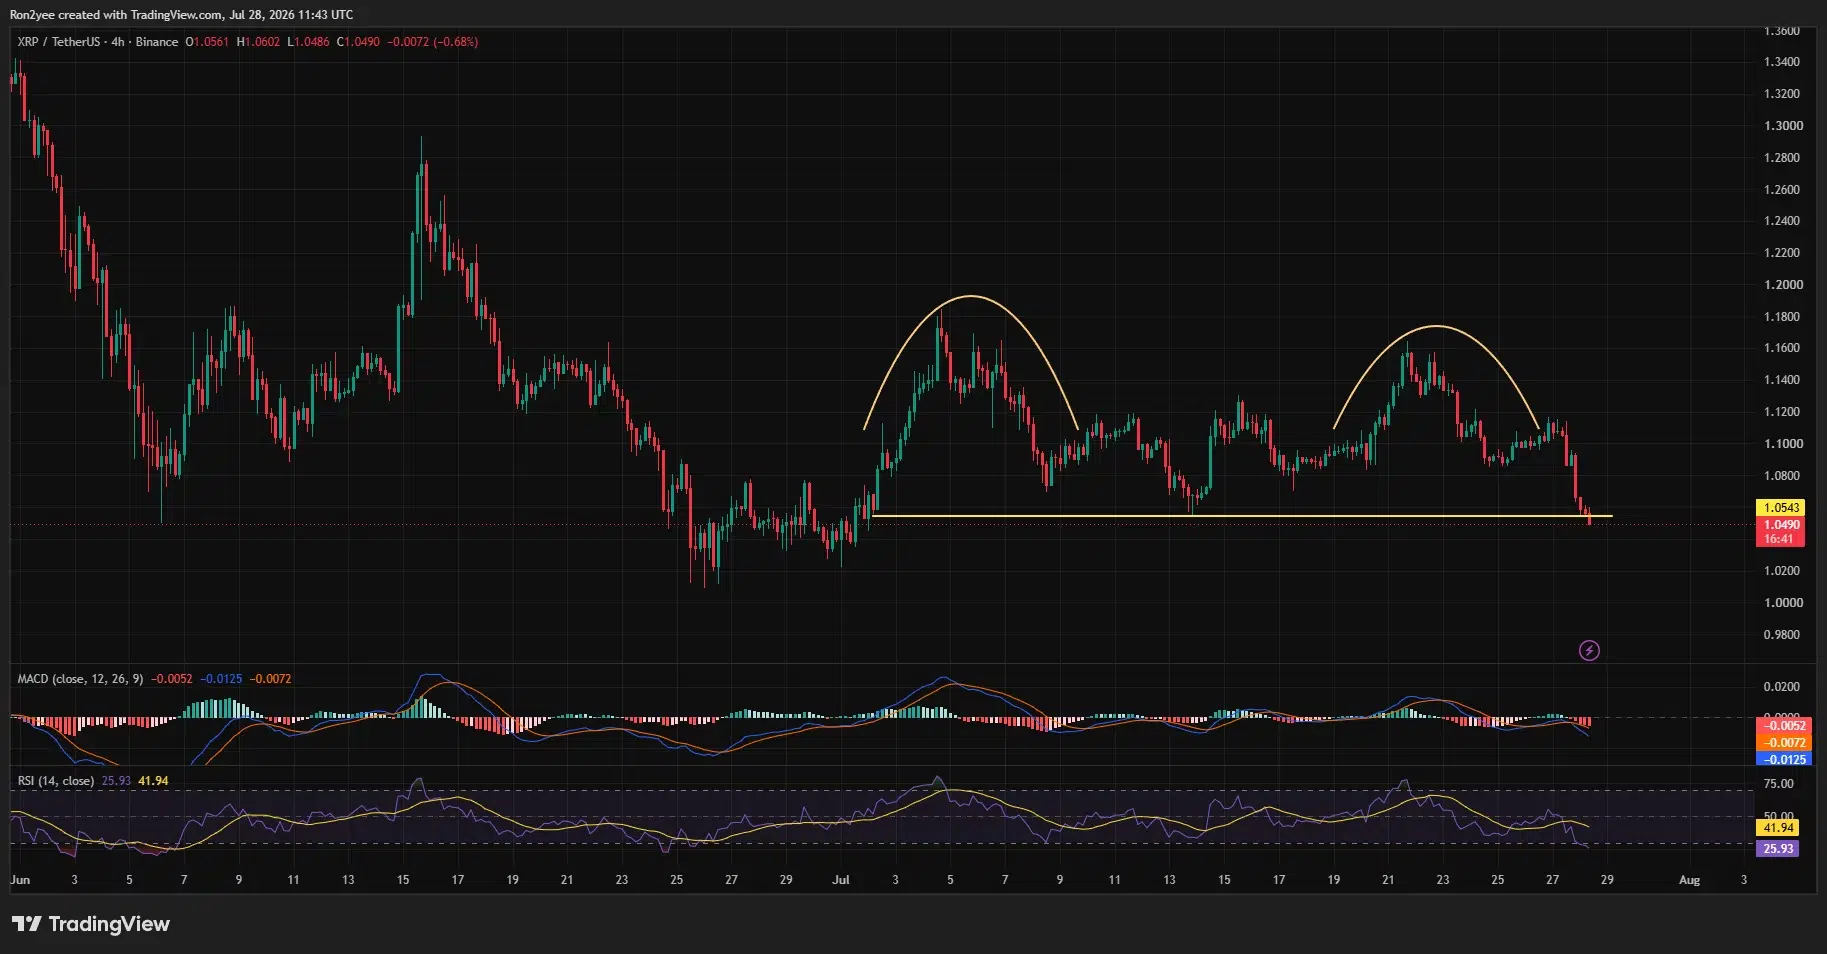
A horizontal neckline near $1.054 separated the pattern from its bearish confirmation. XRP moved below that level on July 28, exposing the psychological $1 mark and the late-June lows between $1.01 and $1.03.
The breakdown followed repeated failures around $1.11 during the previous sessions. Sellers took control once XRP lost $1.08, with the decline accelerating as the price approached the double-top neckline.
Momentum indicators reflect the speed of the move. XRP’s 4-hour relative strength index fell to 25.93, below the 30 level commonly associated with oversold conditions. Its RSI moving average remained much higher at 41.94, showing how rapidly short-term momentum weakened.
Oversold readings can support a temporary rebound, but they do not confirm that a bottom has formed. XRP would first need to recover the broken $1.054 level and then establish a higher low.
Liquidations accelerate XRP’s decline
CoinGlass’ 24-hour liquidation heatmap shows XRP falling from around $1.105 to $1.05 as the market moved through several leveraged trading zones.
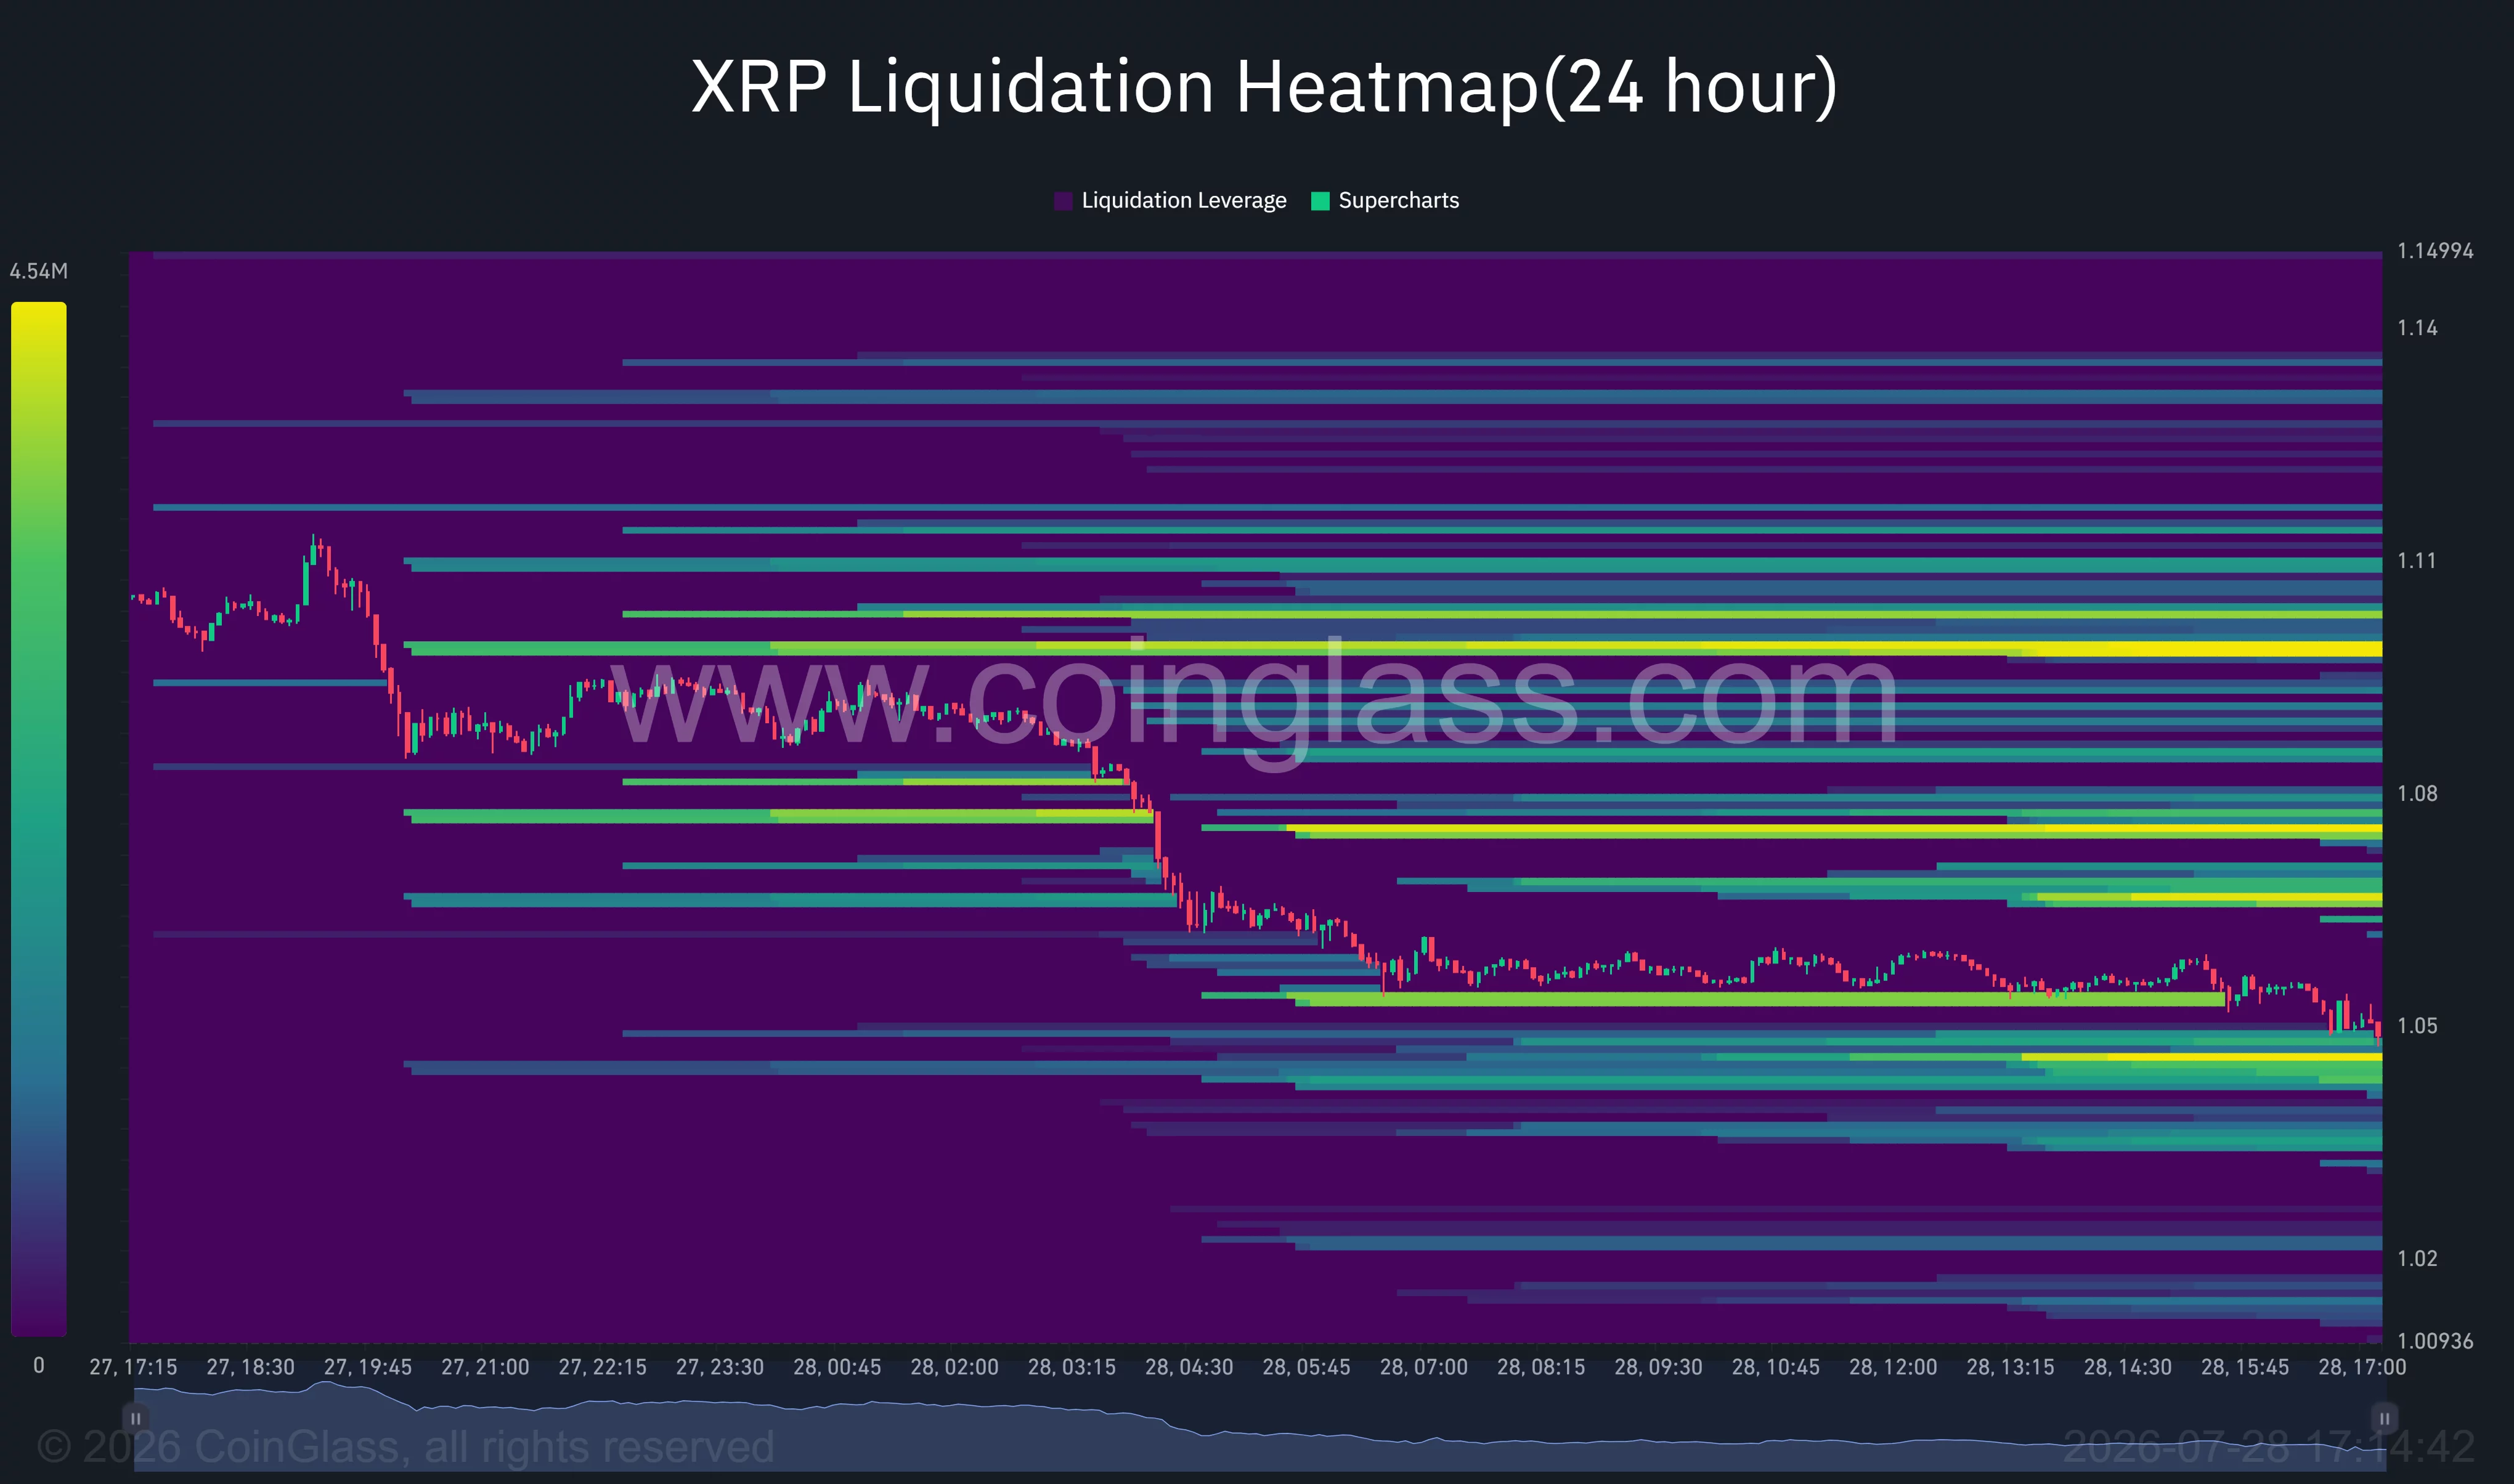
The initial decline cleared liquidity around $1.095 and $1.08. Once those levels failed, the price moved quickly toward $1.06 as leveraged long positions faced liquidation and stop-loss orders were triggered.
XRP now trades near another visible liquidity concentration between $1.043 and $1.05. That cluster could temporarily slow the decline, although a clean move through it would leave less visible support before $1.02.
Most of the larger outstanding liquidity pools are above the current price. The heatmap shows concentrations near $1.062, $1.075 and $1.097, with the largest nearby band sitting just below $1.10.
These levels could act as price magnets during a rebound because traders may target areas where short positions are vulnerable. However, they could also become resistance if holders use a recovery to reduce exposure.
The supplied market brief attributed part of the selling pressure to more than 150 million XRP moving from private wallets to centralized exchanges over 48 hours. Without named transaction records or wallet labels, those transfers should be treated as a reported catalyst rather than confirmed evidence that all the tokens were sold.
XRP indicators point to sustained selling pressure
XRP’s daily chart shows the price closing below the lower Bollinger Band, which stood near $1.0538. A close outside the band reflects unusually strong downside momentum, although it also increases the possibility of a short-term mean-reversion move.
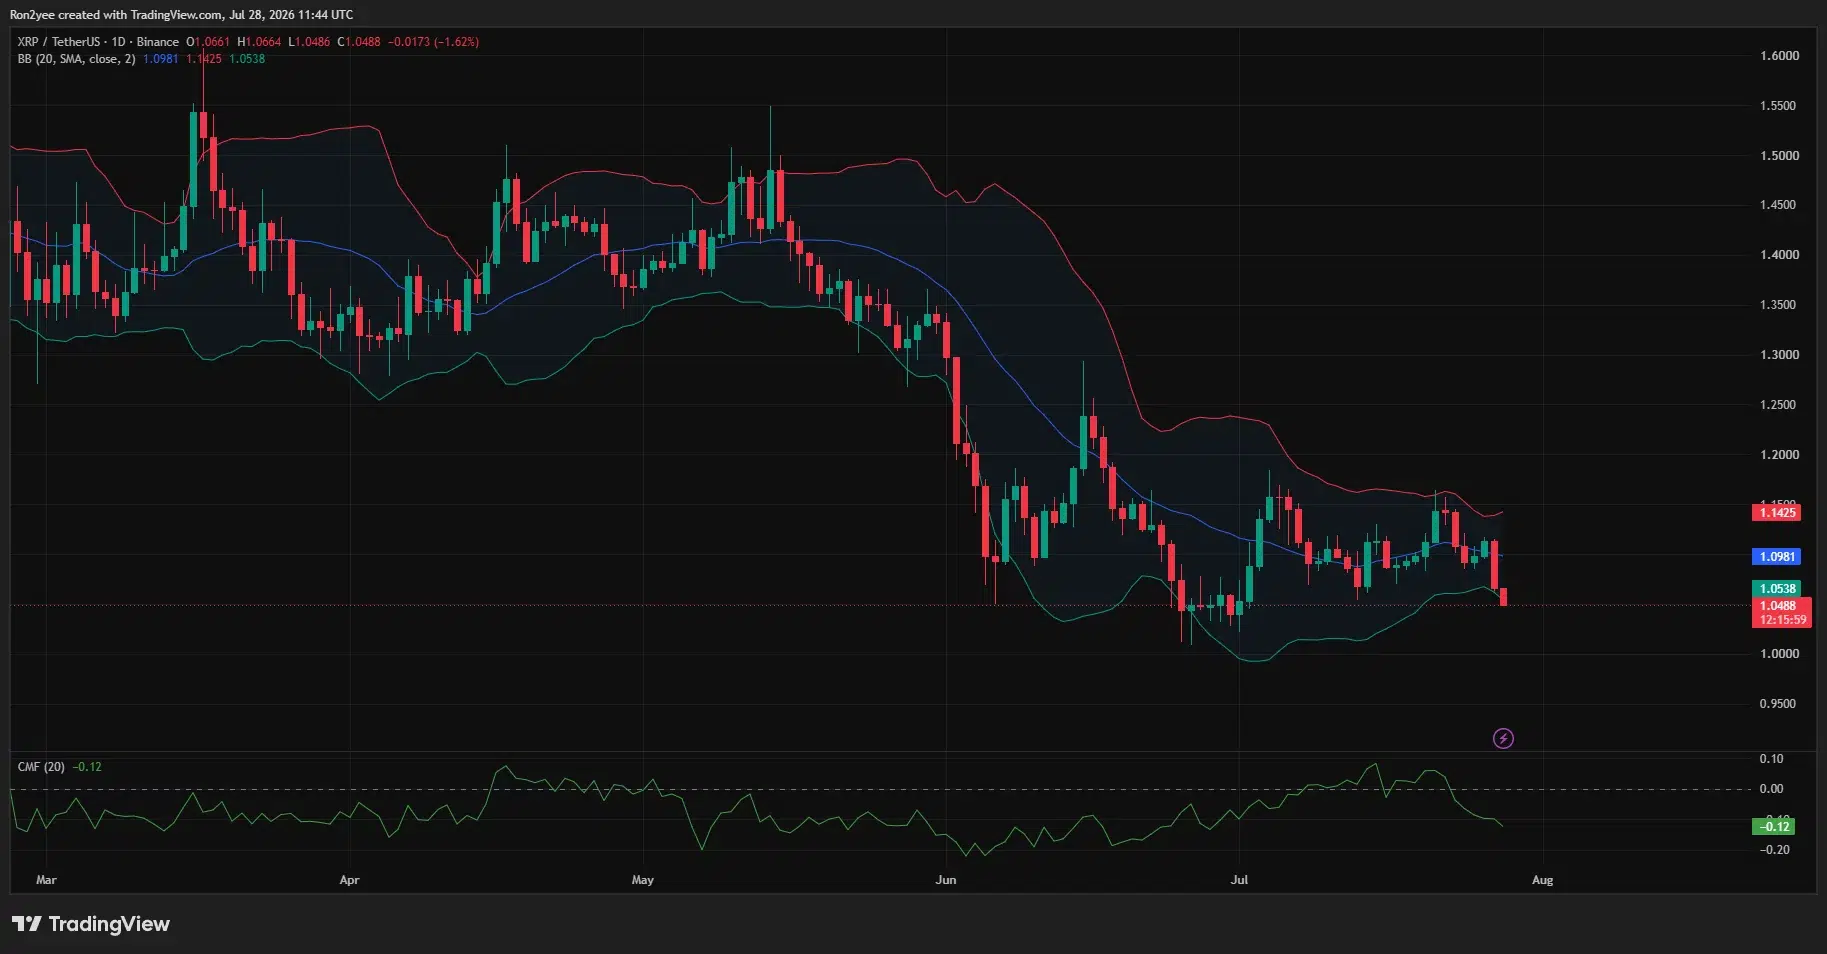
The Bollinger Band midpoint is near $1.0981, closely matching the strongest nearby liquidity cluster on the heatmap. A recovery above that level would return XRP to its recent trading range and weaken the immediate bearish setup.
The upper band sits much higher at $1.1423. XRP would need to reclaim that area before the daily structure begins to shift away from the pattern of lower highs that has developed since May.
Chaikin Money Flow stood at -0.12 on the daily chart. A negative reading indicates that selling pressure has outweighed accumulation during the indicator’s 20-day window.
The 4-hour moving average convergence divergence indicator also remains bearish. The MACD line has dropped to -0.0125, below its -0.0072 signal line, while the histogram stands at -0.0052.
Immediate support sits between $1.043 and $1.05. Below that range, traders may watch $1.02 and $1.00. Resistance is located near $1.054, $1.075, and $1.098, followed by the previous rejection zone around $1.11.
Global selloff adds pressure ahead of the Fed
XRP’s decline coincided with a sharp retreat across Asian technology stocks. South Korea’s Kospi closed 10.84% lower after losses in Samsung Electronics and SK Hynix drove its steepest fall in five months.
That selloff spread through other Asian markets and increased demand for lower-risk positions ahead of the Federal Reserve’s July 28–29 meeting. Higher market volatility can weigh on altcoins because traders often reduce their most speculative holdings first.
Crypto sentiment also faced a US policy setback. Senate leaders temporarily pushed aside the Digital Asset Market Clarity Act while prioritizing federal nominations and a Russia sanctions bill, reducing the time available before the August recess, according to CoinDesk.
Meanwhile, wallets associated with BlackRock’s exchange-traded funds transferred about $271 million in Bitcoin and Ethereum to Coinbase Prime. Such movements can accompany ETF creation and redemption activity, meaning they do not by themselves prove that BlackRock conducted a discretionary market sale.
For US XRP holders, the Federal Reserve meeting and the Senate’s remaining legislative schedule are the main near-term external catalysts. Technically, holding the $1.043–$1.05 zone could produce an oversold bounce, while a daily close below it would increase the risk of a move toward $1.
Disclosure: This article does not represent investment advice. The content and materials featured on this page are for educational purposes only.