10 Charts Which Show This is Just The Beginning of Crypto

The cryptocurrency market has been hailed as a nascent market that continues to experience exponential growth. Though not comprehensive, attempts have been made to define this growth using parameters such as the number of cryptocurrencies listed on the CoinMarketCap, which currently stands at 1,595.
Besides listed cryptocurrencies, other parameters of growth show the market just getting started, as analyzed by Chris McCann.
Growth in Market Cap & Volume
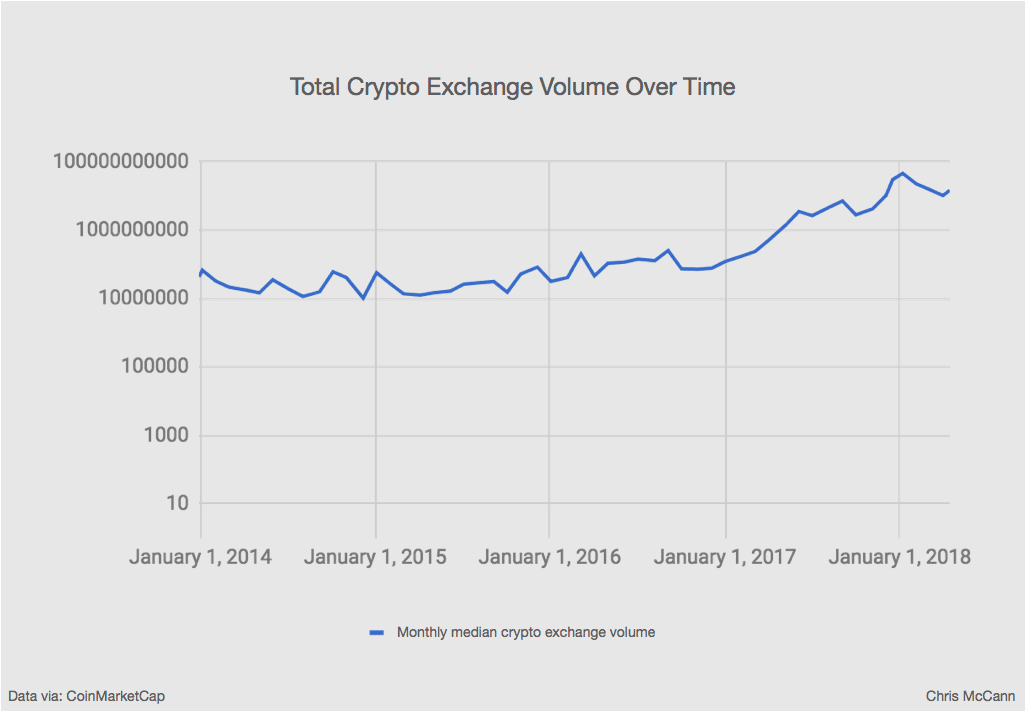
In 2017, the market capitalization of cryptocurrencies registered a 1600 percent growth, from $18 billion at the beginning of the year, to $300 billion toward the end of the year. The market capitalization further rose by more than 100 percent to reach $820 billion in January 2018. The following chart shows the average trading volumes over time.
Growth in Digital Wallets
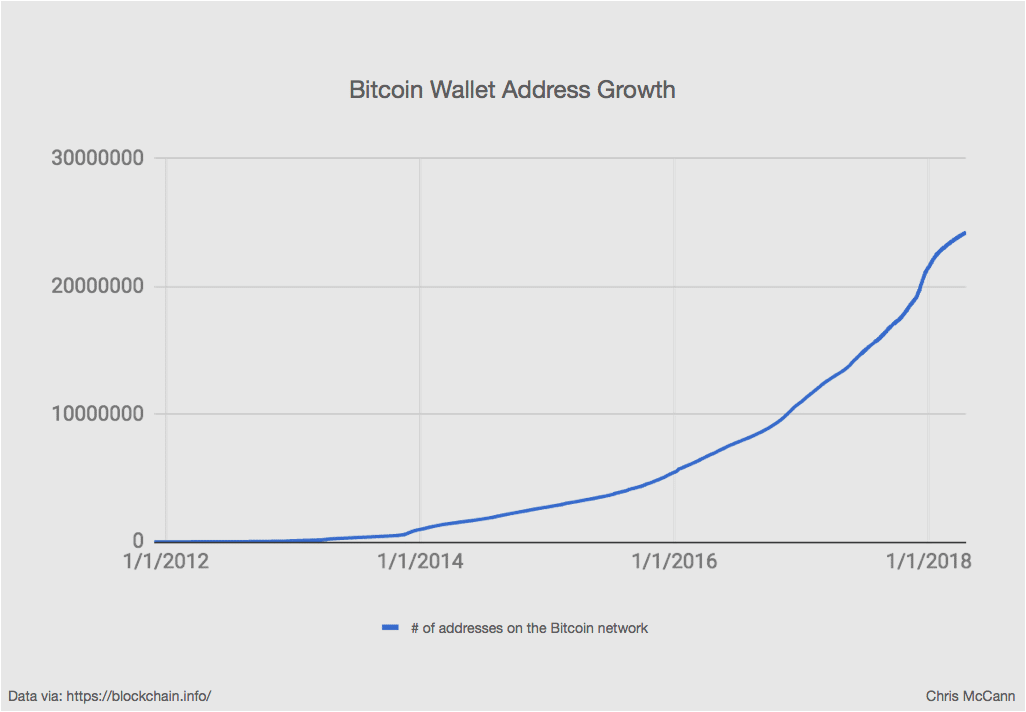
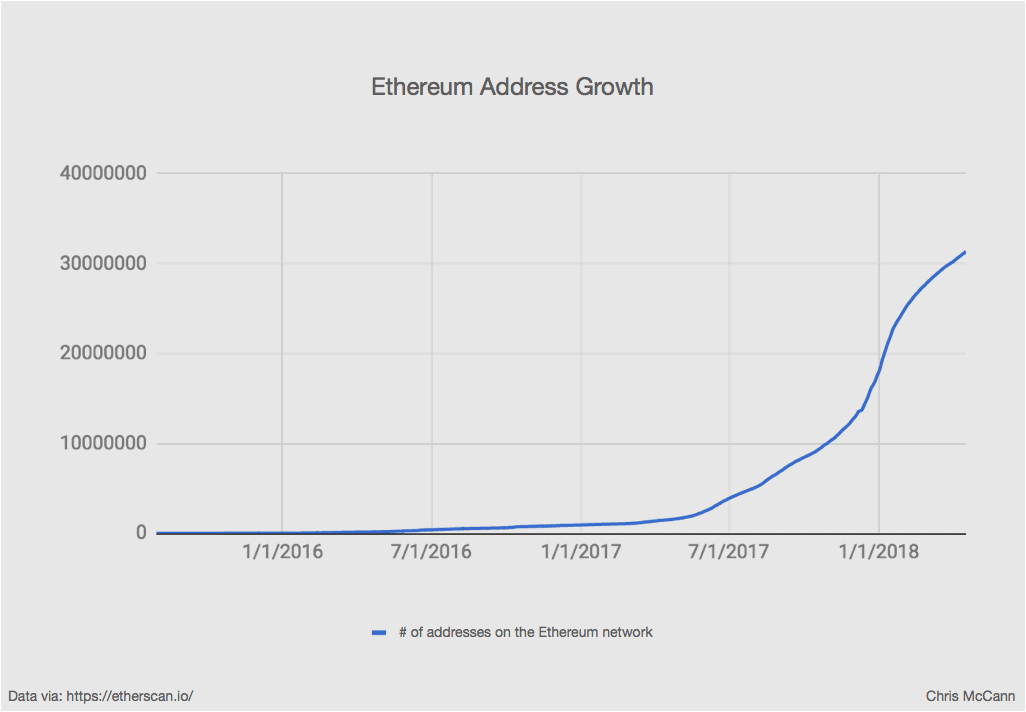
Currently, the number of bitcoin and ether wallets is estimated to be 24 million and 31 million wallets respectively. However, this may not necessarily imply that the number of cryptocurrency users is commensurate to the number of digital wallets available.
A single person could hold several digital wallets since for digital currencies such as bitcoin because it is advisable to create a new wallet for every transaction one sends. These numbers of digital wallets are probably on the higher side. The following chart shows a gradual increase in bitcoin wallets since 2012.
Compared to bitcoin wallets, the number of Ethereum wallets increased rapidly between July 2017 and January 2018 as depicted in the graph below. This may be attributed to the fact that the Ethereum network is a platform for smart contracts which has evolved as a popular choice for launching ICOs.
Growth in Cryptocurrency Exchange Traders
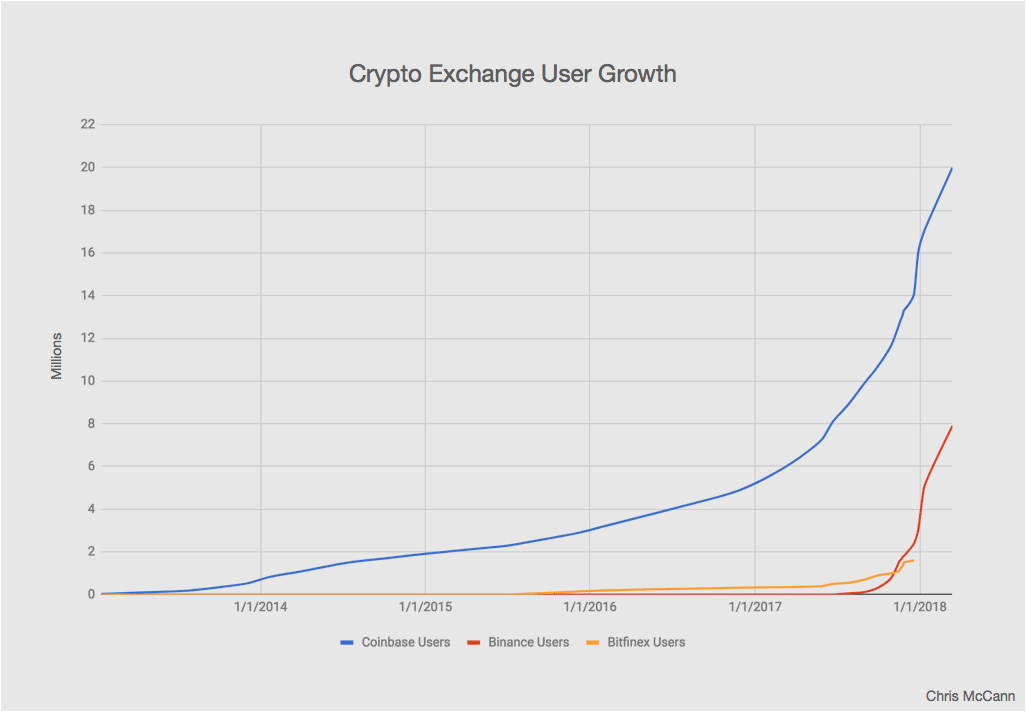
Over the last four years, the number of users on cryptocurrency exchanges has grown gradually. A look at three exchanges shows a rapid increase in user growth occurred in 2017 and 2018 on leading exchanges such as Binance, Bitfinex, and Coinbase. The growth in these years may be attributed to the high performance experienced in 2017 and the expectation that the same would happen in 2018.
The Growth of Internet versus Cryptocurrency Users
Many have likened the potential of virtual currencies with early days of the internet. A closer look at these two revolutionary inventions reveals a similar growth trajectory. From the graph below, cryptocurrency usage seems to be where internet usage was back in 1994.
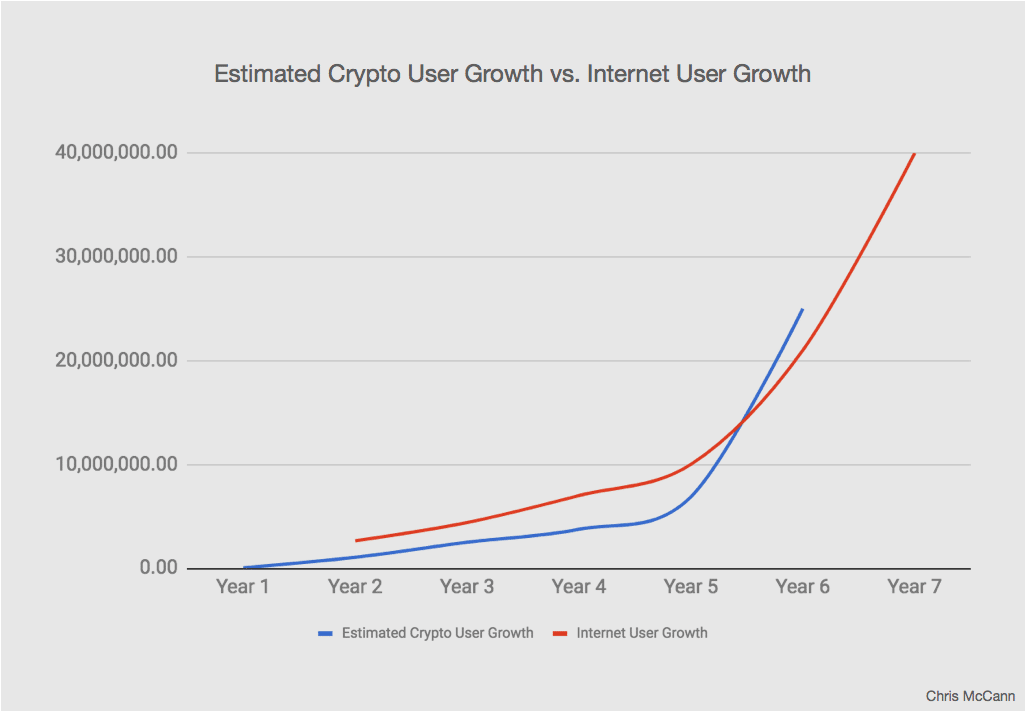
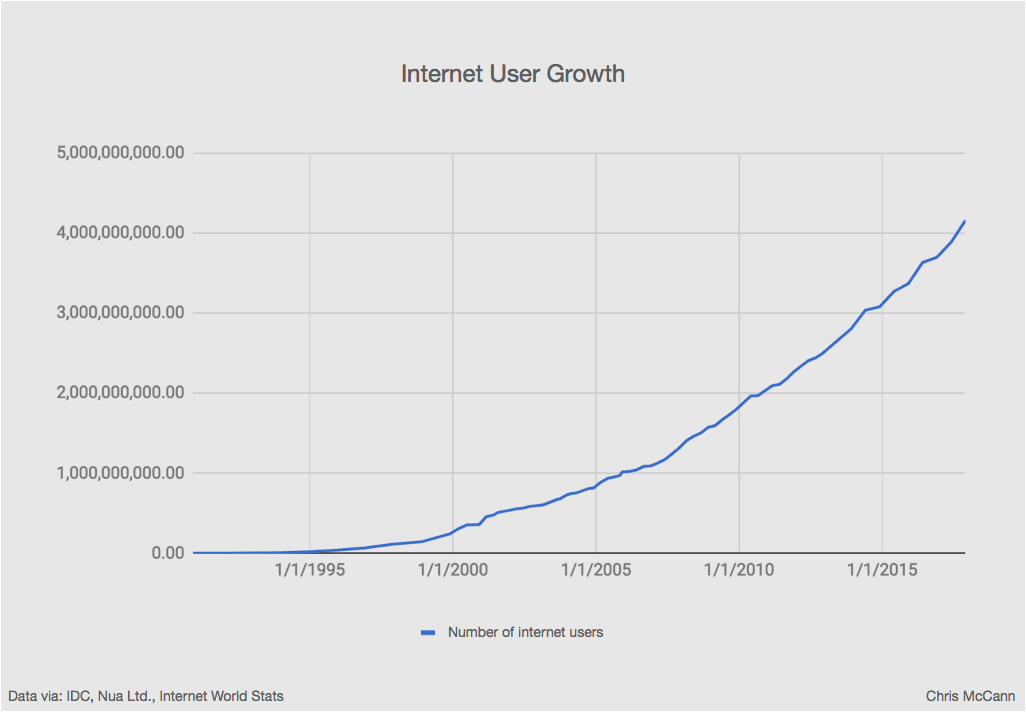
The graph below shows how the number of internet users rose past the four billion mark in 2015. Comparing this to about 20 to 30 million cryptocurrency users today can only mean that crypto is just getting started.
Increase in Daily Active Users
Records show a maximum of 1.1 million active address on the Bitcoin blockchain compared to an estimated 24 million bitcoin wallets that exist on the network.
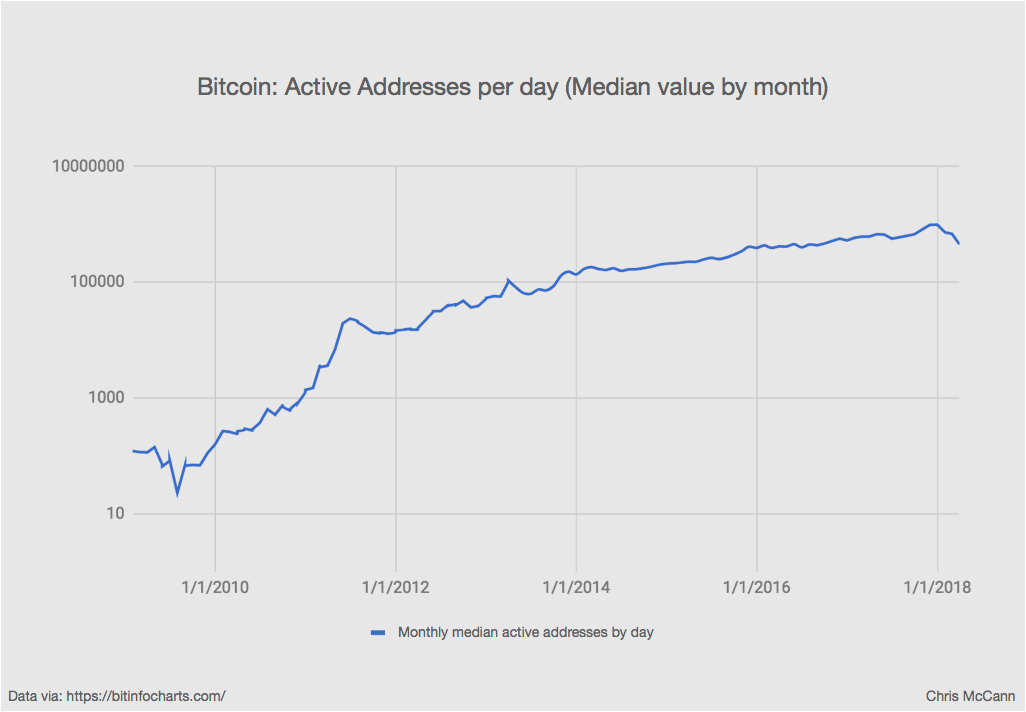
A similar number of active users has also been registered on the Ethereum blockchain compared to 31 million digital addresses available on the network. These figures tell a story of an industry that is just kicking off.

Growth in ICO versus Venture Capital Financing
A review of funding raised through between 2014 and 2018 seems to resemble venture capital financing between 1991 and 1996 as shown in the graph below.
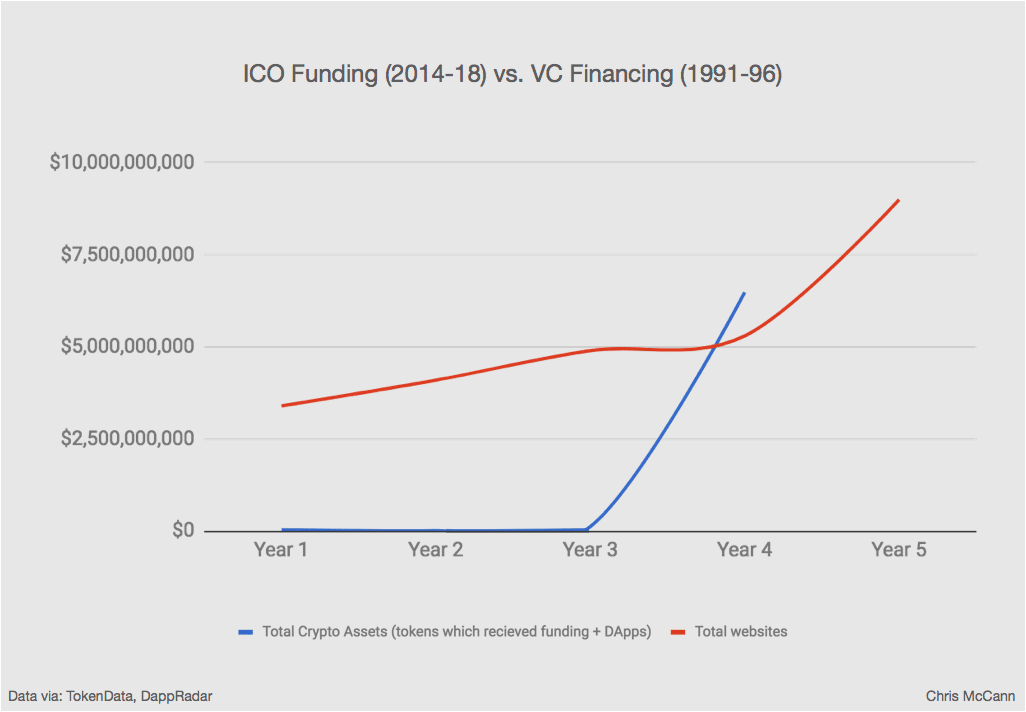
Token Growth versus Website Growth
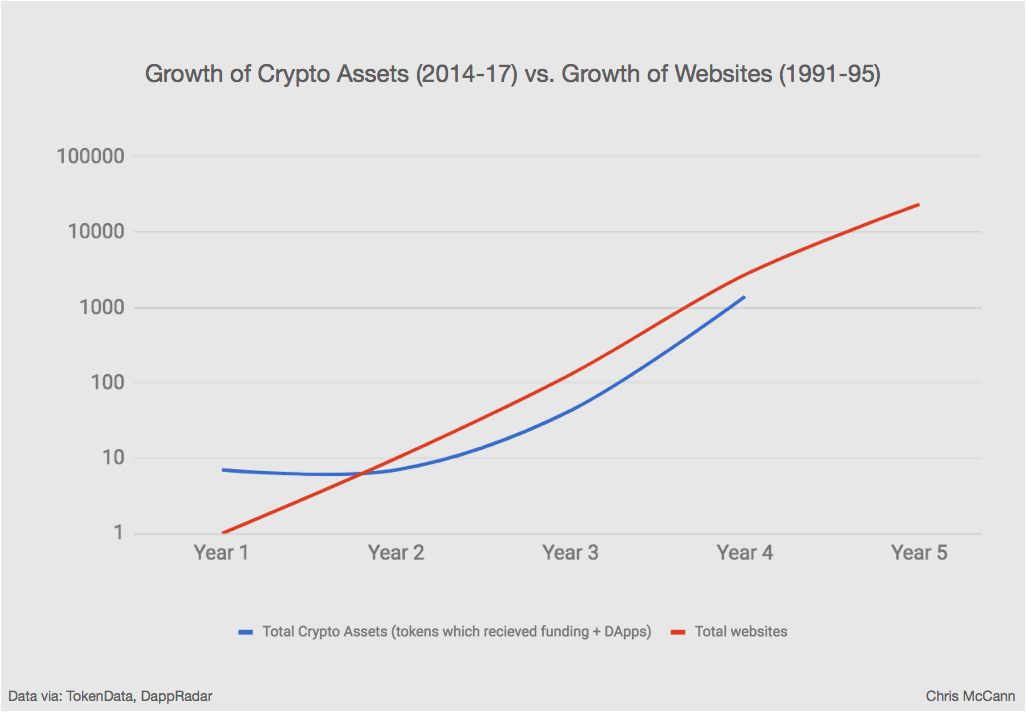
Looking at the trajectory of how funding grew for websites during the internet era and that for tokens in the cryptocurrency era, one notes a similar trend as reflected by the graph below. Even so, it is evident that financing for tokens is gaining momentum faster compared to website financing back in the early 90s. While this may be attributed to the power of the internet, it is clear that the cryptocurrency industry is just beginning.
